
- Saumya Kumar, Chaofan Li, Liang Zhou, et. al.. Nature Immunology volume 27, pages200–212 (2026)
Abstract
The mechanisms driving immune dysregulation in long COVID disease remain elusive. Here we integrated single-cell multiome data, immunological profiling and functional assays to investigate immune alterations across multiple cohorts. A transcriptional state in circulating monocytes (LC-Mo) was enriched in individuals with mild–moderate acute infection and accompanied by persistent elevations of plasma CCL2, CXCL11 and TNF. LC-Mo showed TGFβ and WNT–β-catenin signaling and correlated with fatigue severity. Protein markers of LC-Mo were increased in individuals with pronounced fatigue or dyspnea, and those with severe respiratory symptoms showed higher LC-Mo expression. Epigenetically, LC-Mo exhibited AP-1- and NF-κB1-driven profibrotic programs. LC-Mo-like macrophages in bronchoalveolar lavage samples from individuals with severe respiratory symptoms displayed a profibrotic profile, and individuals with a high LC-Mo transcriptional state showed impaired interferon responses after stimulation. Collectively, our findings define a pathogenic monocyte transcriptional state linking systemic immune dysfunction to persistent long COVID disease, providing mechanistic insights and potential therapeutic targets.
Main
Long COVID affects 10–20% of individuals after severe acute respiratory syndrome coronavirus 2 (SARS-CoV-2) infection, with symptoms ranging from mild discomfort to severe, long-lasting impairments such as fatigue, respiratory issues and neurological problems. These symptoms can persist for over 3 years (refs. 1,2,3,4,5), representing a substantial health burden and prompting efforts to better characterize long COVID (LC), including biomarker discovery for improved diagnosis6,7,8,9,10.
LC presents with diverse symptoms reflecting multiorgan system abnormalities11,12,13. The evidence suggests multiple possible causes, including persistence of viral remnants or reactivation of latent viruses7,14,15,16,17. Yet, persistent immune dysregulation is a consistent finding in LC studies10,11,14,16,17,18,19. Although most LC cases follow mild-to-moderate acute illness, many studies do not stratify individuals by acute infection (AI) severity6,7,8, which is crucial because severe cases, especially those treated in the intensive care unit, develop immune changes due to intensive medical interventions20,21. Failing to account for these differences may confound LC-associated molecular signatures, highlighting the importance of refined patient grouping.
To address this gap, we stratified individuals with LC by acute COVID-19 severity to better resolve immune heterogeneity and identify molecular features underlying chronic symptoms. We applied single-cell multiomics profiling of peripheral blood mononuclear cells (PBMCs) and measured plasma cytokines from individuals with LC with fatigue and respiratory symptoms using longitudinal and cross-sectional samples. We identified a distinct circulating CD14⁺ monocyte state associated with LC (‘LC-Mo’), which was enriched in individuals with mild-to-moderate AI. This state coincided with persistent elevation of circulating cytokines, indicating systemic inflammation. In two independent cohorts of individuals with LC with severe respiratory symptoms and abnormal lung function, LC-Mo expression was increased in circulating CD14⁺ monocyte subsets. In bronchoalveolar lavage (BAL) myeloid cells from individuals with severe respiratory symptoms, LC-Mo-like macrophages showed a profibrotic gene expression profile. Functionally, CD14⁺ monocytes from individuals with LC-Mo enrichment showed dysregulated responses to ex vivo stimulation, indicating impaired immune regulation. Together, these findings provide systemic insight into the cellular and molecular basis of LC and highlight potential therapeutic targets.
Results
LC has a distinct transcriptome after mild or moderate disease
Individuals presenting with headache, dyspnea or fatigue to the pneumology outpatient clinic at Hannover Medical School (MHH) were recruited according to the German S1 guidelines22 and the Delphi Consensus Criteria21 for LC (4–12 weeks) and post-COVID-19 syndrome (>12 weeks). These criteria included symptoms persisting beyond the acute phase of SARS-CoV-2 infection or its treatment, new symptoms emerging after recovery and attributed to prior infection or worsening of pre-existing conditions. Because heterogeneity in LC molecular profiles may be shaped by acute disease severity and treatment, we stratified individuals with acute SARS-CoV-2 infection (AI) and LC into those with mild-to-moderate (WHO score of 1–5) AI (AIM and LCAM) and those with severe (WHO scores 6–9) AI (AIS and LCAS).
Cohort 1 included 45 individuals recruited between April 2020 and August 2021 at MHH, of which 9 gave longitudinal samples and 36 gave cross-sectional samples (n = 78 total samples), including 11 donors with AI categorized as AIM (n = 7 donors, 42.8% women, median age = 52, range 23–66 years of age, WHO score range 1–5) and AIS (n = 4 donors, 50% women, median age = 37, range 32–54, WHO score range 6–9), 37 donors with LC categorized as LCAM (n = 29 donors, 8 longitudinal donors with two to three time points and 21 single-time-point donors, 58% women, median age = 49, range 31–84 years) and LCAS (n = 8 donors, 3 with two to four time points, 5 single-time-point donors, 25% women, median age = 46, range 19–75) and 8 donors who had recovered after 4–8 months of LC (RLC; 1 longitudinal donor with two time points and 7 single-time-point donors, 37.5% women, median age = 38, range 19–65), in addition to 6 prepandemic noninfected control individuals (NI; 50% women, median age = 40, range 24–61). LC and RLC samples were collected 1.7–10.2 months after infection. Cohort 2 included 117 LCAM donors (24 donors with two to four time points, 93 single-time-point donors, 58.9% women, median age = 48, range 19–83) and 25 LCAS donors (12 longitudinal donors, 13 single-time-point donors, 20% women, median age = 53, range 18–81), recruited between May 2020 and August 2021 at MHH, along with 33 prepandemic NI samples (48.4% women, median age = 40, range 25–65). Cohort 3 included only LCAM donors (n = 8 donors, 62.5% women, median age = 45, range 21–63), all with respiratory postacute sequelae of SARS-CoV-2 infection (PASC) recruited between October and November 2023 at the Pulmonary Rehabilitation Clinic in Schönau am Königssee, Germany. Cohort 4 included LCAM donors (n = 29, 58.6% women, median age = 49, range 33–72), LCAS donors (n = 11 donors, 18% female, median age = 57, range 35–81), 8 donors recovered from AI (RA) and 2 NI donors (60% women, median age = 41, range 29–67) recruited between August 2020 and June 2022 at MHH. Cohort 5 included LC donors (n = 9 donors, 44.4% women, median age = 64, range 62–83, including 5 with respiratory PASC) and NI donors (n = 2 donors, 50% women, median age = 77, range 73–77), recruited between October 2020 and November 2021 at Mayo Clinic, a previously published study23 (Fig. 1a and Methods).
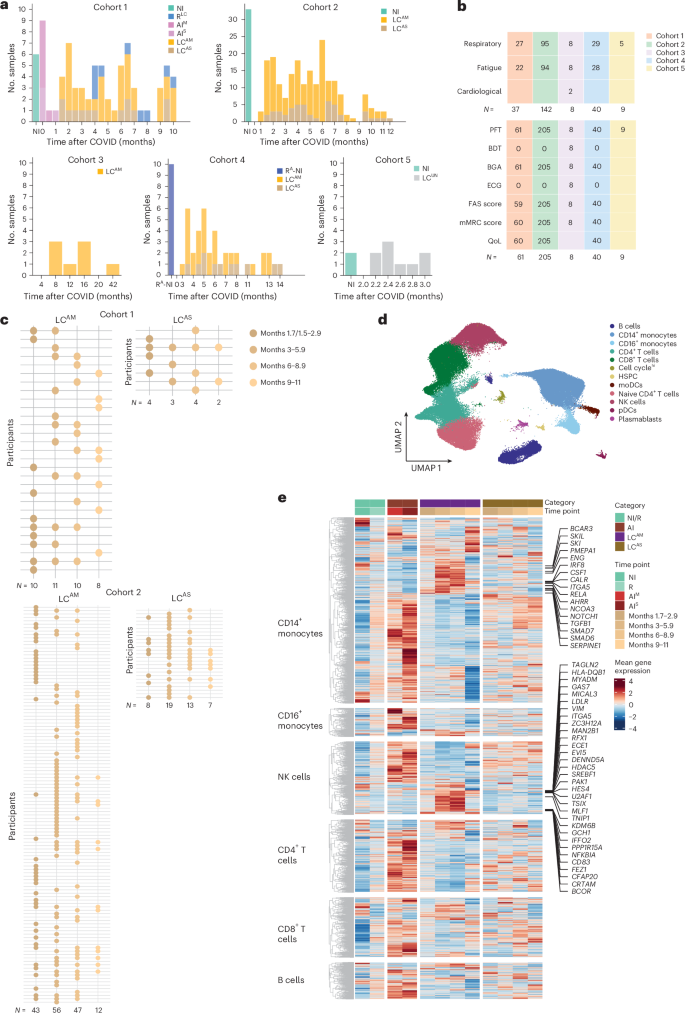
Clinical assessment included blood gas analysis, pulmonary function tests and standardized participant-reported outcome measures: the fatigue assessment scale (FAS), validated in chronic fatigue24,25,26 and LC, and the modified medical Research Council (mMRC) dyspnea scale (0–4, where 0 indicates no breathlessness, 1 indicates breathlessness on exertion, 2 indicates breathlessness when hurrying or walking uphill, 3 indicates stopping for breath after ~100 m or a few minutes, and 4 indicates too breathless to leave the house or when dressing), along with quality-of-life metrics27. All clinical assessment data were systematically collected at each participant visit for cohorts 1–4 (Fig. 1b and Supplementary Tables 1–5).
To study molecular signatures of disease progression, we stratified samples in cohorts 1 and 2 by months since AI (months 1.5/1.7–2.9, 3–5.9, 6–8.9 and 9–11; Fig. 1c and Methods). For cohort 1, we generated single-nucleus RNA-sequencing (snRNA-seq) and single-nucleus assay for transposase-accessible chromatin with sequencing (snATAC-seq) data from 78 PBMC samples from NI, RLC, AIM, AIS, LCAM and LCAS donors across all time points. In cohort 2 we measured the concentrations of 14 cytokines in plasma samples from LCAM or LCAS and NI donors across all time points. Validation was performed using single-cell RNA-sequencing (scRNA-seq; cohort 3), flow cytometry (cohort 4) and a published PBMC/BAL single-cell dataset23 (cohort 5). All samples, except those from participants with AI, were PCR negative at collection. We used an integrative multistep analysis to identify cell-type-specific immune dysregulation and link and assess relevance in LC (Extended Data Fig. 1a).
Analysis of single-cell data from cohort 1 PBMCs yielded ~118,000 high-quality cells (Fig. 1d). snRNA-seq data showed distinct patterns in LCAM and LCAS compared to RLC and AI across major PBMCs (Fig. 1e). LCAM showed downregulated AI genes by months 6–8.9, whereas LCAS retained an acute COVID-19-like transcriptomic profile, indicating heterogeneity based on AI history (Fig. 1e). Differential gene expression (DGE) analysis identified 1,737 upregulated genes in CD14+ monocytes from LCAM donors compared to those from AI and RLC (Fig. 1e), with upregulation over 1.7–8.9 months, and showed participant-specific heterogeneity (Fig. 1e and Extended Data Fig. 1b). LCAM CD14+ monocytes showed persistent upregulation of proinflammatory (CSF1, IRF8, RELA and NOTCH1) and anti-inflammatory (TGFB1, SMADs, ENG and SERPINE1) markers (Extended Data Fig. 1c) at all time points, whereas other signature genes showed increased expression from 3 to 8.9 months (Fig. 1e). This signature diminished during months 9–11, possibly due to lower cell numbers (Extended Data Fig. 1d), but showed upregulation of a subset of acute-phase genes, including IL1B, S100A4, PDIA3 and MTRNR2L1. LCAM natural killer (NK) cells also showed distinct increased expression of SREBF1, TAGLN2, TNIP1, NFKBIA and CD83 among others compared to RLC and AI NK cells (Fig. 1e). Collectively, transcriptional profiles in individuals with LC reflected differences based on AI severity, with notable molecular changes in LCAM monocytes and NK cells, whereas LCAS displayed persistent but milder expression of acute-phase genes.
TNF and TNF signaling genes are upregulated in LCAM
We next performed gene set enrichment analysis (GSEA) using pseudobulk counts for each cell subset in LCAM or LCAS samples across all time points, comparing them to the AI and RLC cell samples. LCAM showed persistent upregulation of the TNF signaling pathway and persistent downregulation of interferon (IFN) signaling and response pathways across all major cell subsets (CD4+ and CD8+ T cells, B cells and CD14+ and CD16+ monocytes) compared to AI, up to month 8.9 (Fig. 2a and Extended Data Fig. 2a). CD8+ T cells and NK cells from LCAM samples exhibited increased activation of the ‘TLR signaling cascades’ pathway relative to RLC samples at months 3–8.9 (Fig. 2a). In LCAM CD14+ monocytes, the TNF signaling pathway was transiently upregulated at months 1.7–5.9 and downregulated at months 6–8.9, whereas pathways including transforming growth factor-β (TGFβ), WNT–β-catenin and Notch signaling were upregulated at months 3–8.9 compared to in AI and RLC CD14+ monocytes (Fig. 2a). In LCAS, the TNF signaling pathway was sparsely activated in CD14+ monocytes and CD8+ T cells up to 5.9 months (Extended Data Fig. 2b). LCAS CD14+ monocytes upregulated PD-1 signaling and MHC class II antigen presentation pathways compared to AI, but not RLC (Extended Data Fig. 2b, top). CD8+ and CD4+ T cells and NK cells from LCAS samples displayed increased activation of IFN response pathways compared to CD8+ and CD4+ T cells and NK cells from RLC samples (Extended Data Fig. 2b).
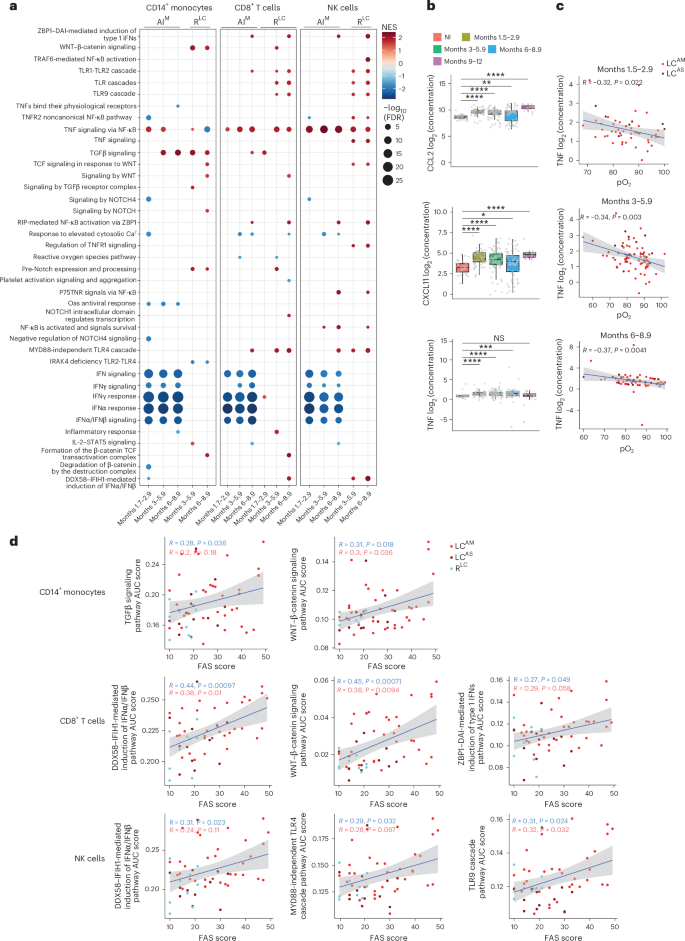
We also profiled 14 proinflammatory cytokines in cohort 2 plasma using a multiplex bead-based assay (Extended Data Fig. 2c), excluding interleukin-4 (IL-4) and IL-5 due to low detection. CXCL11, CCL2 and TNF were persistently elevated in individuals with LC compared to in NI donors up to month 9 (Fig. 2b). TNF mRNA was also persistently upregulated in individuals with LCAM across most immune cell types and time points (Extended Data Fig. 2d). TNF protein exhibited a statistically significant negative correlation with arterial oxygenation (pO2) in individuals with LC (Fig. 2c), which remained statistically significant in LCAM, but not in LCAS, up to month 8.9 (Extended Data Fig. 3a). No other cytokines showed consistent correlations across all time points (Extended Data Fig. 3b,c).
Correlation analysis between key pathways upregulated in CD8+ T cells, NK cells and CD14+ monocytes and FAS scores indicated that TGFβ and WNT–β-catenin signaling in CD14+ monocytes showed modest positive correlations with FAS scores in LC alone and stronger correlations when LC and RLC were combined (Fig. 2d). IFNα/IFNβ induction pathways positively correlated with FAS scores in CD8+ T cells and NK cells in both LC only or LC + RLC combined analyses (Fig. 2d). WNT–β-catenin signaling in CD8+ T cells and Toll-like receptor (TLR) signaling cascades in NK cells, but not TNF signaling in these cells, also correlated with FAS scores (Fig. 2d). These results indicate that persistent upregulation of inflammatory pathways and cytokines in LCAM immune cells might contribute to the clinical symptoms in LC.
The LCAM monocyte signature characterizes a transcriptional state
Next, we performed a reclustering analysis of CD8+ T cells, NK cells and CD14+ monocytes from all donor samples. CD8+ T cells and NK cells each resolved into five clusters (Fig. 3a,b). Differential neighborhood abundance analysis (DA) comparing LC groups at each time point to AI and RLC was performed. A neighborhood defines a small local group of cells with similar gene expression profiles, representing transitional states. LCAM samples exhibited statistically significant increased abundance of neighborhoods in CD69hiCD27hi CD8+ T cells (C3), GZMB+KLRF1+ NK cells (C1) and CD69+TGFB1+ NK cells (C2; Extended Data Fig. 4a,b), whereas LCAS samples showed increased abundance of neighborhoods in C2 NK cells at months 6–8.9 (Extended Data Fig. 4c,d). C3 CD8+ T cells and C2 NK cells showed GZMK+GZMBlo signatures (Extended Data Fig. 4e,f), reported to accumulate after SARS-CoV-2 infection and in aging28,29,30. These clusters showed higher expression of TNF and TLR signaling genes (Fig. 3a,b), suggesting the contribution of persistent TNF signaling in the expansion of CD69hiCD27hiGZMK+ CD8+ T cells and CD69+TGFB1+GZMK+ NK cells in individuals with LCAM.
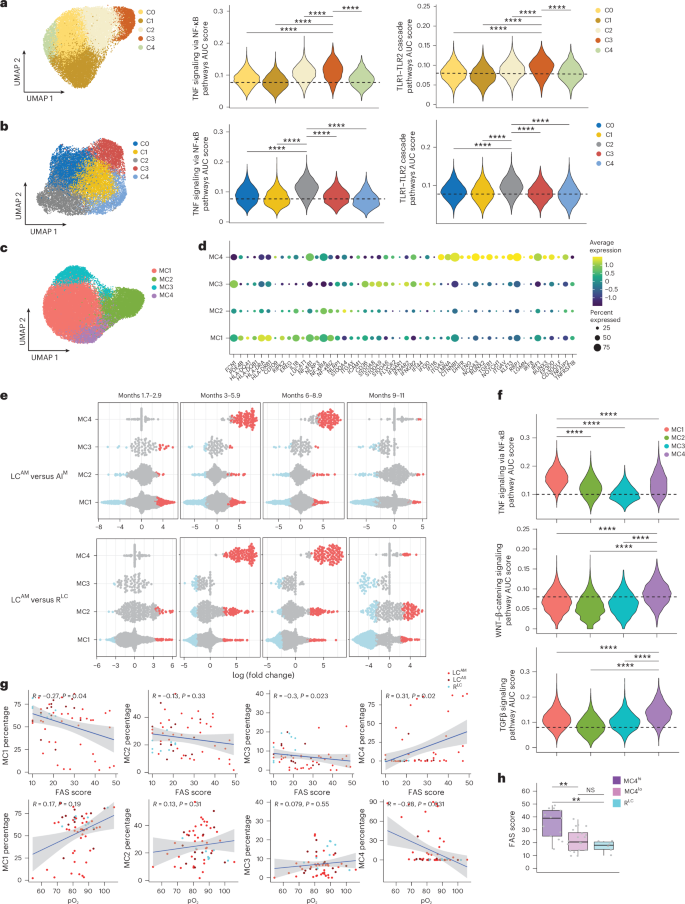
Within CD14+ monocytes, four primary clusters (MC1–MC4) were identified (Fig. 3c). MC1 showed high expression of MHC class II molecules, IL1B and NFKB1; MC2 showed elevated NFKB1 and S100A4; MC3 showed increased expression of FCN1, IFN-stimulated genes (IFI44, IFI16 and IFI30) and alarmins S100A8 and S100A9; and MC4 displayed higher levels of IRF1, IRF8, TGFB1, CTNNB1, ENG and NOTCH1, among others (Fig. 3d). DA comparing LC samples with AI and RLC samples across all time points showed a consistent significant increase in MC4 neighborhoods in LCAM in both men and women (Fig. 3e and Extended Data Fig. 4g), with this becoming prominent from month 3 onward (Fig. 3e and Extended Data Fig. 5a). By contrast, MC1 neighborhoods showed a marked increase, primarily at months 1.7–2.9, and ‘tapering off’ by month 11 (Fig. 3e). LCAS did not exhibit consistent changes in MC4, except for a small number of neighborhoods at months 6–8.9 attributable to one participant (Extended Data Fig. 5b). Further, area under the curve (AUC) scores of pathways (calculated per cell from all donors) revealed that MC4, which was uniquely abundant in LCAM, showed significantly higher expression of TGFβ and WNT–β-catenin signaling genes than MC1, MC2 and MC3 (Fig. 3f). MC1 showed higher expression of the TNF signaling genes (Fig. 3f), whereas MC1 and MC3 showed higher IFNγ response gene expression (Extended Data Fig. 5c). We further performed trajectory analysis (unstratified by disease category or groups) that revealed that lineage 3 overlapped closely with the MC4 immune program (Extended Data Fig. 5d,e), indicating that MC4 cells in LCAM have a distinct transcriptional profile compared to MC1–MC3. We next assessed the correlation between the frequency of MC4 within CD14+ monocytes for all LC and RLC samples from all time points with clinical parameters. A modest but statistically significant positive correlation was found between MC4 proportion and FAS score, whereas the correlation with pO2 was negative (Fig. 3g). By contrast, a higher MC1 proportion was negatively correlated with FAS score (Fig. 3g). The modest MC4–FAS correlation likely reflected participant heterogeneity (Extended Data Fig. 5f). Individuals with LC with a high proportion of MC4 (MC4hi) exhibited significantly greater fatigue than those with LC with a low proportion of MC4 (MC4lo) or RLC (Fig. 3h). These findings indicate that increased MC4 abundance (referred to hereafter as LC monocyte transcriptional state (LC-Mo state)) is associated with LC, as demonstrated by its correlation with both FAS scores and pO2 levels.
LC monocytes exhibit increased LC-Mo protein marker expression
To validate the LC-Mo state, we generated and analyzed scRNA-seq data from PBMCs from cohort 3, comprising eight individuals with LCAM with LC symptoms reported for 8–42 months at the time of sampling (Supplementary Table 3 and Methods). All individuals with LC reported fatigue and dyspnea (classified as respiratory PASC (‘Resp-PASC’), n = 5), and three exhibited bronchial hyper-responsiveness (BHR)31, termed ‘Resp-PASC-BHR’ (n = 3). Three clusters (Clust0–Clust2) were identified within CD14+ monocytes (Fig. 4a). Clust1 showed significantly elevated AUC scores for the LC-Mo signature (Fig. 4b). Individuals with Resp-PASC-BHR showed significantly higher expression of the LC-Mo signature in Clust1 than those with Resp-PASC (Fig. 4c), providing independent validation of the LC-Mo state in LCAM and suggesting a link with progression to severe respiratory PASC.
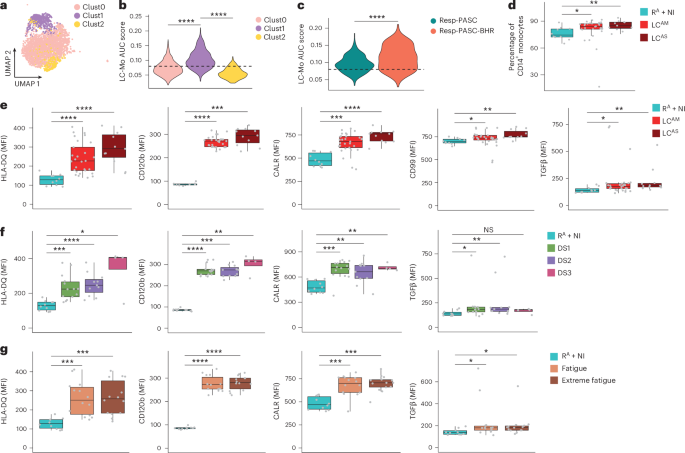
We next performed flow cytometry analysis on PBMCs from donors in cohort 4, which included 40 LC samples 3–14 months after acute COVID-19 (Supplementary Table 4 and Methods) and 10 RA or NI donors. LC showed a significant increase in CD14+ monocyte percentages compared to RA + NI (Fig. 4d), independent of acute COVID-19 severity. We assessed the expression of 11 proteins (HLA-DR, HLA-DQ, CD105, CD51, TGFβ1, CD99, CD120b, CALR, IRF8, IFNGR1 and CD163) corresponding to LC-Mo transcripts in total CD14+ monocytes in samples from individuals with LC and RA + NI (Extended Data Fig. 6a). Median fluorescence intensity (MFI) of HLA-DQ, CD120b, CALR, CD99 and TGFβ1 was significantly higher in LC compared to in RA + NI (Fig. 4e and Extended Data Fig. 6b), whereas HLA-DR, CD51, CD105, IRF8, IFNGR1 and CD163 showed no significant difference (Extended Data Fig. 6c). Stratification by fatigue scores and dyspnea (range 1–3) revealed consistently higher MFI of CALR, CD120b, HLA-DQ and TGFβ1 in those with more severe LC symptoms (Fig. 4f,g), and TGFβ1 MFI inversely correlated with pO2 (Extended Data Fig. 6d, top). MFI of both TGFβ1 and IRF8 positively correlated with each other (Extended Data Fig. 6d, bottom). Thus, protein markers specific to LC-Mo were elevated in LC, supporting an association between the LC-Mo signature and LC pathology.
Chromatin profiling reveals AP-1/NF-κB1 activity in LC-Mo
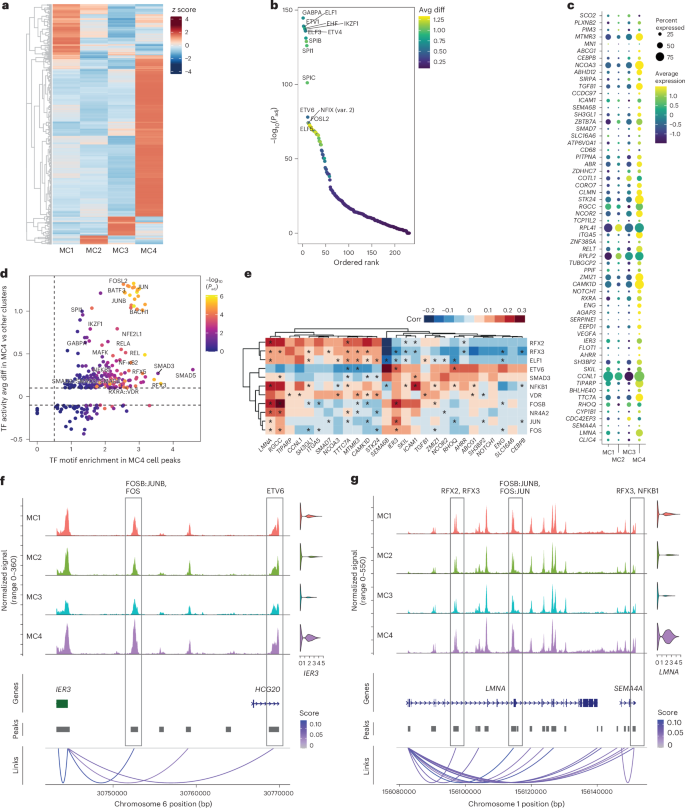
We next investigated epigenetic regulation using snATAC-seq data from individuals with LC in cohort 1. Examination of motif signals in the chromatin landscapes of CD14+ monocytes, CD8+ T cells and NK cells from individuals with LCAM compared to those with RLC at multiple time points identified a persistent positive signal for AP-1 family activity in CD8+ T cells and NK cells (Extended Data Fig. 7a). In CD14+ monocytes, AP-1 motif accessibility was elevated up to month 5.9, after which motif enrichment shifted toward transcription factors involved in downstream TGFβ signaling, notably SP1 and KLF family of transcription factors at months 3–8.9 (Extended Data Fig. 7b). MC4 showed the highest number of differentially accessible regions (Fig. 5a). The open chromatin landscape of MC4 showed highest enrichment for motifs for ETS family transcription factors, including GABPA, ETV1, ETV4, SPI1 and SPIC (Fig. 5b). Correlating open chromatin regions with gene expression revealed significant positive associations for proangiogenic and cell adhesion genes (VEGFA, ENG, TGFB1, RXRA, ICAM1 and ITGA5) and genes implicated in inflammatory/metabolic diseases (TTC7A, LMNA and IER3) among others (Fig. 5c). AP-1 family, SMADs, NF-κB1 and RELA transcription factor motifs showed a marked increase within the accessible chromatin regions of these genes (Fig. 5d). Within MC4, correlation of transcription factor transcripts and target gene transcripts with accessible motifs enabled pinpointing of noncoding regulatory regions associated with gene expression, such as those for IER3 and LMNA, and establishment of gene–transcription factor relationships (such as NF-κB1 and AP-1 family likely regulators of LMNA; Fig. 5e–g and Extended Data Fig. 7c). In summary, these findings indicate that LC-Mo is driven by ETS, AP-1 and NF-κB1 transcription factors.
BAL myeloid cells show LC-Mo and profibrotic programs
Circulating monocytes contribute to PASC pathogenesis, particularly pulmonary fibrosis23,32. To assess whether LC-Mo participates in fibrotic lung remodeling, we analyzed paired PBMC and BAL fluid samples from a public dataset23 (cohort 5) consisting of nine individuals with LC of unknown severity during AI (LCUN), classified based on lung function as Resp-PASC (n = 5) or nonResp-PASC (n = 4), and PBMCs from NI donors (n = 2; Supplementary Table 5). Circulating CD14+ myeloid cells were reclustered to identify CD14+CD16− monocytes (Extended Data Fig. 8a), leading to six clusters (CL0–CL5; Fig. 6a). CL5 showed the highest enrichment of LC-Mo signature AUC scores (Fig. 6b and Extended Data Fig. 8b). Within cluster 5, Resp-PASC exhibited significantly higher LC-Mo expression than nonResp-PASC or NI (Fig. 6c).
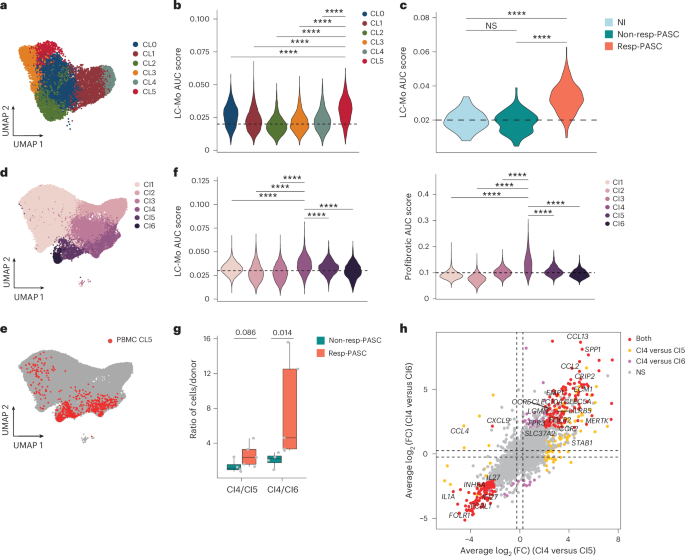
We next integrated CD14+ monocytes from PBMCs and CD163+ or CD14+ myeloid cells from BAL fluid. This integrated dataset identified CI1 with >75% cells from BAL fluid and expressing MARCO+FABP4+, markers for tissue-resident alveolar macrophages, two clusters (CI2 and CI3) with >65% of cells from PBMCs and expressing LYZ+CD14+, markers for circulating monocytes, and three mixed clusters (CI4–CI6) with comparable proportion of cells from both PBMCs and BAL (Fig. 6d and Extended Data Fig. 8c,d). PBMC monocytes in CL5 primarily localized to clusters CI4–CI6 (Fig. 6e), suggesting a macrophage-polarized phenotype. Among these, cluster CI4 had the highest LC-Mo signature enrichment and higher expression of a profibrotic gene set defined in prior COVID-19 BAL studies33 and including TREM2, CALM1, LGMN and APOE (Fig. 6f and Extended Data Fig. 8e). Individuals with resp-PASC showed a higher proportion of CI4 cells and higher CI4/CI5 and CI4/CI6 ratios than individuals without resp-PASC (Fig. 6g and Extended Data Fig. 8f). Differential expression analysis revealed that CI4 cells upregulated the expression of SPP1, CCL13, CCL2 and FOLR2 compared to CI5 or CI6 cells from both individuals with resp-PASC and non-resp-PASC (Fig. 6h). These results indicate LC-Mo enrichment in Resp-PASC PBMCs and its association with a profibrotic transcriptional profile in lung myeloid cells.
Individuals with LC-Mo exhibit dysregulated monocyte function
To assess the functional implications of LC-Mo during immune challenge, we stimulated PBMC samples from cohort 1 (months 1.7–2.9 and 6–8.9) with heat-inactivated Pseudomonas aeruginosa for 4 h and performed single-cell multiome profiling in samples from individuals with LCAM (n = 7), LCAS (n = 5) and RLC (n = 6; Extended Data Fig. 9a,b). Stimulation resulted in a reduction in the numbers of CD14+ and CD16+ monocytes compared to unstimulated samples (Extended Data Fig. 9c,d), consistent with prior reports34,35. Joint analysis of stimulated and unstimulated samples showed that stimulated LCAM CD14+ monocytes exhibited significant downregulation of the inflammatory response, IFNγ signaling, IL-10 signaling, cytokine signaling and IL-6–JAK–STAT3 signaling pathways relative to stimulated RLC CD14+ monocytes (Extended Data Fig. 9e). Next, we classified donors as LC-Mohi (>10% of CD14+ monocytes exhibiting the LC-Mo state) or LC-Molo (<10%); all RLC and LCAS samples were LC-Molo (Extended Data Fig. 5f). Comparison of stimulated LC-Mohi and LC-Molo identified DHFR, HMOX1, EREG and GCLC among the top significantly upregulated DEGs (Fig. 7a). Pathways related to ‘IFNα response’ and ‘cytokine signaling’ were significantly decreased in expression (Fig. 7b) in stimulated LC-Mohi compared to stimulated LC-Molo. At the gene level, stimulation induced cytokine and chemokine gene expression (CCL3, CCL4, CXCL3 and IL6) in both stimulated LC-Mohi and stimulated LC-Molo, whereas IFN response genes (IRF9, ASCC3, XAF1, SAMD9L, LILRB4 and CGAS) were downregulated in LC-Mohi (Fig. 7c). Motif accessibility analysis of stimulated LC-Mohi and stimulated LC-Molo showed that FOXO and TCF (especially TCF7L2) and ZIC motifs were more accessible in stimulated LC-Mohi, whereas stimulated LC-Molo showed increased ETS and AP-1 motif accessibility compared to stimulated LC-Mohi (Extended Data Fig. 9f). Together, these data suggest that LC-Mo might contribute to the functional immune dysregulation observed in individuals with LC.