Gwenaëlle Douaud, Soojin Lee, Fidel Alfaro-Almagro, Christoph Arthofer, Chaoyue Wang, et. al. Nature volume 604, pages697–707 (2022)Cite this article
Abstract
There is strong evidence of brain-related abnormalities in COVID-191,2,3,4,5,6,7,8,9,10,11,12,13. However, it remains unknown whether the impact of SARS-CoV-2 infection can be detected in milder cases, and whether this can reveal possible mechanisms contributing to brain pathology. Here we investigated brain changes in 785 participants of UK Biobank (aged 51–81 years) who were imaged twice using magnetic resonance imaging, including 401 cases who tested positive for infection with SARS-CoV-2 between their two scans—with 141 days on average separating their diagnosis and the second scan—as well as 384 controls. The availability of pre-infection imaging data reduces the likelihood of pre-existing risk factors being misinterpreted as disease effects. We identified significant longitudinal effects when comparing the two groups, including (1) a greater reduction in grey matter thickness and tissue contrast in the orbitofrontal cortex and parahippocampal gyrus; (2) greater changes in markers of tissue damage in regions that are functionally connected to the primary olfactory cortex; and (3) a greater reduction in global brain size in the SARS-CoV-2 cases. The participants who were infected with SARS-CoV-2 also showed on average a greater cognitive decline between the two time points. Importantly, these imaging and cognitive longitudinal effects were still observed after excluding the 15 patients who had been hospitalised. These mainly limbic brain imaging results may be the in vivo hallmarks of a degenerative spread of the disease through olfactory pathways, of neuroinflammatory events, or of the loss of sensory input due to anosmia. Whether this deleterious effect can be partially reversed, or whether these effects will persist in the long term, remains to be investigated with additional follow-up.
Main
The global pandemic of SARS-CoV-2 has now claimed millions of lives across the world. There has been an increased focus by the scientific and medical community on the effects of mild-to-moderate COVID-19 in the longer term. There is strong evidence for brain-related pathologies, some of which could be a consequence of viral neurotropism1,2,14 or virus-induced neuroinflammation3,4,5,15, including the following: neurological and cognitive deficits demonstrated by patients6,7, with an incidence of neurological symptoms in more than 80% of the severe cases8, radiological and post mortem tissue analyses demonstrating the impact of COVID-19 on the brain9,10, and the possible presence of the coronavirus in the central nervous system11,12,13.
In particular, one consistent clinical feature, which can appear before the onset of respiratory symptoms, is the disturbance in olfaction and gustation in patients with COVID-1916,17. In a recent study, 100% of the patients in the subacute stage of the disease were displaying signs of gustatory impairment (hypogeusia), and 86%, signs of either hyposmia or anosmia18. Such loss of sensory olfactory inputs to the brain could lead to a loss of grey matter in olfactory-related brain regions19. Olfactory cells—whether neuronal or supporting—concentrated in the olfactory epithelium are also particularly vulnerable to coronavirus invasion, and this seems to be also the case specifically with SARS-CoV-217,20,21,22. Within the olfactory system, direct neuronal connections from and to the olfactory bulb encompass regions of the piriform cortex (the primary olfactory cortex), parahippocampal gyrus, entorhinal cortex and orbitofrontal areas23,24.
Most brain imaging studies of COVID-19 to date have focussed on acute cases and radiological reports of single cases or case series based on computed tomography (CT), positron emission tomography (PET) or magnetic resonance imaging (MRI) scans, revealing a broad array of gross cerebral abnormalities, including white matter hyperintensities, hypoperfusion and signs of ischaemic events spread throughout the brain, but found more consistently in the cerebrum9. Of the few larger studies focussing on cerebrovascular damage using CT or MRI, some have either found no clear marker of abnormalities in the majority of their patients, or importantly no spatially consistent pattern for the distribution of white matter hyperintensities or microhaemorrhages, except perhaps in the middle or posterior cerebral artery territories and the basal ganglia9. Imaging cohort studies of COVID-19, quantitatively comparing data across participants through automated preprocessing and co-alignment of images, are much rarer. For example, a recent PET cohort study focussing on correlates of cognitive impairment demonstrated, in 29 patients with COVID-19 at a subacute stage, the involvement of fronto-parietal areas revealed as fluorodeoxyglucose (18F-FDG) hypometabolism18. Another glucose PET study has shown bilateral hypometabolism in the bilateral orbital gyrus rectus and the right medial temporal lobe25. One multiorgan imaging study26 (and its brain-focussed follow-up27) in over 50 previously hospitalised patients with COVID-19 suggested modest abnormalities in T2* of the left and right thalami compared with matched controls. However, it remains unknown whether any of these abnormalities predates the infection by SARS-CoV-2. These effects could be associated with a pre-existing increased brain vulnerability to the deleterious effects of COVID-19 and/or a higher probability to show more pronounced symptoms, rather than being a consequence of the COVID-19 disease process.
UK Biobank offers a unique resource to elucidate these questions. With the data from this large, multimodal brain imaging study, we used for the first time a longitudinal design whereby participants had been already scanned as part of UK Biobank before being infected by SARS-CoV-2. They were then imaged again, on average 38 months later, after some had either medical and public health records of COVID-19, or had tested positive for SARS-CoV-2 twice using rapid antibody tests. Those participants were then matched with control individuals who had undergone the same longitudinal imaging protocol but had tested negative using the rapid antibody test or had no medical record of COVID-19. In total, 401 participants with SARS-CoV-2 infection with usable imaging data at both time points were included in this study, as well as 384 control individuals, matched for age, sex, ethnicity and time elapsed between the two scans. These large numbers may enable us to detect subtle, but consistent spatially distributed sites of damage associated with the infection, therefore underlining in vivo the possible spreading pathways of the effects of the disease within the brain (whether such effects relate to the invasion of the virus itself11,14,20, inflammatory reactions3,4,15, possible anterograde degeneration starting with the olfactory neurons in the nose, or through sensory deprivation19,28,29). The longitudinal aspect of the study aims to help to tease apart which of the observed effects between the first and second scans are probably related to the infection, rather than due to pre-existing risk factors between the two groups.
Our general approach in this study was therefore as follows: (1) use brain imaging data from 785 participants who visited the UK Biobank imaging centres for two scanning sessions, on average 3 years apart, with 401 of these having been infected with SARS-CoV-2 in between their two scans; (2) estimate—from each participant’s multimodal brain imaging data—hundreds of distinct brain imaging-derived phenotypes (IDPs), each IDP being a measure of one aspect of brain structure or function; (3) model confounding effects, and estimate the longitudinal change in IDPs between the two scans; and (4) identify significant SARS-CoV-2 versus control group differences in these longitudinal effects, correcting for multiple comparisons across IDPs. We did this for both a focussed set of a priori-defined IDPs, testing the hypothesis that the olfactory system is particularly vulnerable in COVID-19, as well as an exploratory set of analyses considering a much larger set of IDPs covering the entire brain. In both cases, we identified significant effects associated with SARS-CoV-2 infection primarily relating to greater atrophy and increased tissue damage in cortical areas directly connected to the primary olfactory cortex, as well as to changes in global measures of brain and cerebrospinal fluid volume.
Participants
UK Biobank has been releasing data from the COVID-19 re-imaging study on a rolling basis. As of 31 May 2021, 449 adult participants met the re-imaging study inclusion criteria (see the ‘Study design’ section of the Methods) and were identified as having been infected with SARS-CoV-2 based on either their primary care (GP) data, hospital records, results of their diagnostic antigen tests identified through record linkage to the Public Health datasets in England, Wales and Scotland, or two concordant antibody-based home lateral flow kit positive results. Of these 449 adult participants who had tested positive for SARS-CoV-2, a total of 401 had usable brain scans at both time points (Tables 1 and 2). For the 351 individuals for whom we had a diagnosis date based on their medical records or antigen tests, the time between diagnosis (a proxy for infection) and their second imaging scan was on average 141 days (Table 2 and Supplementary Fig. 1). Table 1 Main demographics of the participants
Full size table Table 2 Main clinical information for SARS-CoV-2 cases
In total, 384 adult control participants met the inclusion criteria (see the ‘Study design’ section of the Methods) and had usable brain scans at both time points (Table 1). SARS-CoV-2 positive or negative status was identified using UK Biobank Showcase variable 41000.
Despite the original matched pairing of the SARS-CoV-2 cases and controls, their age distributions were slightly—albeit not statistically significantly—different, due to different patterns of missing/usable data (Extended Data Fig. 1). Note that the control group is on average slightly (albeit not significantly) older than the SARS-CoV-2-positive group, which would be expected to make any change between the two time points more difficult to detect in the group comparisons, rather than easier. Histograms of interval of time between the two scans in the two groups are shown in Extended Data Fig. 2.
The two groups showed no statistical differences across all 6,301 non-imaging phenotypes after false-discovery rate (FDR) or family-wise error (FWE) correction for multiple comparisons (lowest PFWE = 0.12, and no uncorrected P values survived FDR correction). However, owing to the stringent correction for multiple comparisons that this analysis imposes, we investigated further whether subtle patterns of baseline differences could be observed using dimension reduction with principal component analysis on all 6,301 variables, and using a separate principal component analysis focussed on baseline cognition (Supplementary Analysis 1). We found no principal components that differed significantly between the two groups when examining all of the non-imaging variables. With respect to cognitive tests, although no single cognitive score was significantly different at baseline between control individuals and participants who were later infected (future cases), we identified two cognitive principal components that were different (Supplementary Analysis 1). These subtle baseline cognitive differences suggest that the future cases had slightly lower cognitive abilities compared with the control individuals. Importantly, none of these principal components—cognitive or otherwise—could statistically account for the longitudinal imaging results (see the ‘Additional baseline investigations’ section below).
Through hospital records, we identified 15 participants in the SARS-CoV-2-positive group who had been hospitalised with COVID-19, including 2 who received critical care (Tables 2 and 3). These hospitalised patients were on average older, had higher blood pressure and weight, and were more likely to have diabetes and be men, compared with non-hospitalised cases (Table 3).Table 3 Comparison between hospitalised versus non-hospitalised SARS-CoV-2 cases
Hypothesis-driven results
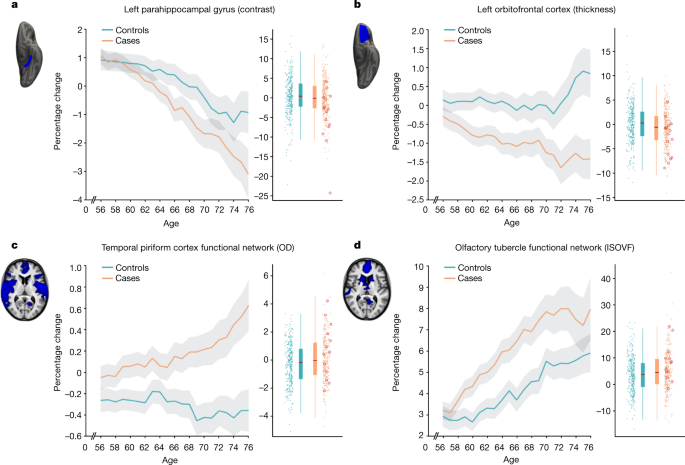
The main case-versus-control analysis between the 401 SARS-CoV-2 cases and 384 controls (Model 1) on 297 olfactory-related cerebral IDPs yielded 68 significant results after FDR correction for multiple comparisons, including 6 that survived FWE correction (Table 4 and Fig. 1; a full list of the results is provided in Supplementary Table 1). Focussing on the top 10 most significant associations, 8 of these IDPs covered similar brain regions that are functionally connected to the primary olfactory cortex (see the ‘Hypothesis-driven approach’ section in the Methods), showing overlap especially in the anterior cingulate cortex, orbitofrontal cortex and insula, as well as in the ventral striatum, amygdala, hippocampus and parahippocampal gyrus30. We found a greater longitudinal increase in diffusion indices for the SARS-CoV-2 group in these tailored IDPs defining the functional connections with the frontal and temporal piriform cortex, as well as the olfactory tubercle and anterior olfactory nucleus (Table 4, Fig. 1 and Supplementary Table 1). The other two of the top 10 IDPs encompassed the left lateral orbitofrontal cortex and parahippocampal gyrus, both showing a greater reduction in grey matter thickness or intensity contrast over time for cases compared with controls (Table 4, Fig. 1 and Supplementary Table 1). For those significant IDPs, the average differences in percentage change between the two groups were moderate, ranging from around 0.2% to about 2%, with the largest differences observed in the volume of the parahippocampal gyrus and entorhinal cortex (Supplementary Table 1). Scatter and box plots, as well as plots showing the percentage changes with age are available for the top 10 longitudinal IDPs (Supplementary Information, Longitudinal Plots).Table 4 Top 10 of the 68 significant results for the hypothesis-driven olfactory approach
As secondary analyses, we found that significant longitudinal differences remained in the same set of significant brain regions that survived FDR or FWE correction when removing from the SARS-CoV-2 group those patients who had been hospitalised with COVID-19 (Model 2, 47 IDPs significant after FDR correction, 3 of which were also significant after FWE correction; Supplementary Table 1). Although fewer results were significant for the comparison between the 15 hospitalised patients and 384 control individuals (Model 3, 4 results were significant after FDR correction; Supplementary Table 1), probably due to the large reduction in sample size for this model, this additional group comparison showed effects in the same regions of the parahippocampal gyrus, orbital cortex and superior insula. Finally, we found no significant differences between the 15 hospitalised patients and 386 non-hospitalised SARS-COV-2 cases, probably due to the large reduction in sample size, but effect sizes and direction of these effects suggested stronger detrimental effects for the hospitalised cases in the orbitofrontal, insula, parahippocampal and frontal piriform cortex functionally connected brain regions (all |Z| ≥ 3, Model 4; Supplementary Table 1).
Across the three models comparing SARS-CoV-2 cases with controls (Models 1–3), the top 4 longitudinal differences were found in the functionally connected regions of the temporal piriform cortex (diffusion index: orientation dispersion) and of the olfactory tubercle (diffusion index: isotropic volume fraction), as well as in the parahippocampal gyrus (intensity contrast) and lateral orbitofrontal cortex (thickness) (largest combined |Z| across Models 1–3; Fig. 1). For these results across Models 1–3, the percentage of participants infected with SARS-CoV-2 who showed a greater longitudinal change than the median value in the control individuals was 56% for the regions connected to the temporal piriform cortex, 62% for the regions connected to the olfactory tubercle, 57% for the left parahippocampal gyrus and 60% for the left orbitofrontal cortex.
Although significant IDPs related to grey matter thickness were found, using our main case-versus-control analysis (Model 1), to be bilateral for both the anterior parahippocampal gyrus (perirhinal cortex) and entorhinal cortex, 10 out of the 11 remaining significant IDP were left-lateralised (Supplementary Table 1). Thus, we directly investigated left–right differences in the group with SARS-CoV-2 only for those significant IDPs, and found that the participants with an infection did not have a significantly greater reduction in grey matter thickness in the left hemisphere compared with in the right hemisphere (lowest Puncorr = 0.30).
Of the top 10 IDPs showing a longitudinal effect between first and second scans, none correlated significantly with the time interval between their infection and their second scan, in the participants who tested positive for SARS-CoV-2 for whom we had a date of diagnosis (n = 351; lowest Puncorr = 0.08).
Exploratory results
In total, 2,047 IDPs passed the initial tests of reproducibility (Extended Data Fig. 3) and data completeness. The main analysis (Model 1) revealed 65 significant longitudinal differences between the cases and controls that passed FDR correction, including 5 that were significant after FWE correction (Table 5; a complete list of reproducible IDPs and results is provided in Supplementary Table 1). Extended Data Figs. 4 and 5 show the QQ plot relating to the FDR thresholding, and a summary figure of Z-statistics results for all 2,047 IDPs grouped into different IDP classes. Table 5 Top 10 of 65 significant results for the exploratory approach
In particular, in this exploratory analysis covering the entire brain, 33 out of the 65 significant IDPs overlapped with the IDPs selected a priori for our hypothesis-driven approach of the involvement of the olfactory system. Moreover, we found significant longitudinal effects in global measures of volume, such as the cerebrospinal fluid (CSF) volume normalised for head size and the ratio of the volume of the segmented brain to the estimated total intracranial volume generated by FreeSurfer, as well as in the volume of the left crus II of the cerebellum, the thickness of the left rostral anterior cingulate cortex and diffusion index in the superior fronto-occipital fasciculus (Table 5 and Supplementary Table 1; examples are provided in Extended Data Fig. 6). For those significant IDPs, average differences in the percentage change between the two groups were moderate, ranging from around 0.2% to about 2% (except for two diffusion measures in the fimbria at >6%, due to the very small size of these regions of interest), with the largest differences observed in the volume of the parahippocampal gyrus and caudal anterior cingulate cortex (Supplementary Table 1). Scatter and box plots, as well as plots showing the percentage longitudinal changes with age are available for the top 10 longitudinal IDPs (Supplementary Information, Longitudinal Plots).
For the secondary analyses, when comparing the non-hospitalized cases with the controls (Model 2), the same general pattern emerged, albeit with a reduced number of significant results: one olfactory-related region, the functionally connected areas to the temporal piriform cortex, showed a significant longitudinal difference between the two groups in a diffusion index, as well as one global volume measure (CSF normalised), and a diffusion index in the superior fronto-occipital fasciculus (Model 2; 4 after FDR correction, 1 after FWE correction; Supplementary Table 1). Despite the considerably limited degrees of freedom in Models 3 and 4, many results remained significant after correction for multiple comparison, particularly for IDPs of cortical thickness, with an emphasis on the anterior cingulate cortex for Model 3 (66 results after FDR correction, 3 results after FWE correction), and a wide distribution across prefrontal, parietal and temporal lobes for Model 4 (29 FDR-corrected results; Fig. 2).
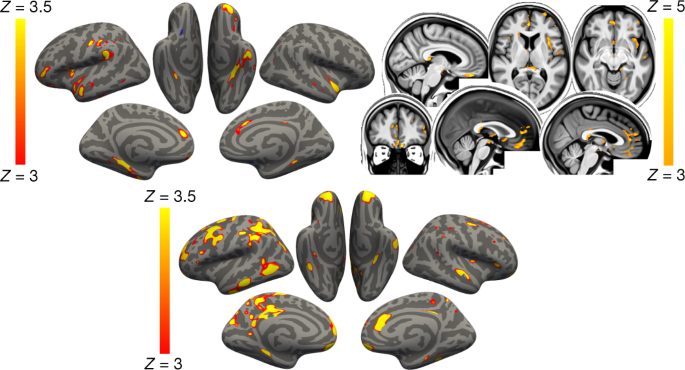
As many of the top exploratory and hypothesis-driven results included IDPs of cortical thickness and of mean diffusivity, we further conducted an exploratory visualisation of the vertex-wise thickness, and voxel-wise mean diffusivity longitudinal differences between the cases and controls over the entire cortical surface and brain volume, respectively (Fig. 2). Grey matter thickness showed bilateral longitudinal differences in the parahippocampal gyrus, anterior cingulate cortex and temporal pole, as well as in the left orbitofrontal cortex, insula and supramarginal gyrus.
When visually comparing hospitalised and non-hospitalised cases, these longitudinal differences showed a similar pattern, especially in the parahippocampal gyrus, orbitofrontal and anterior cingulate cortex, but also markedly extending, particularly in the left hemisphere, to many fronto-parietal and temporal regions. Mean diffusivity differences in longitudinal effects between cases and controls were seen mainly in the orbitofrontal cortex, anterior cingulate cortex, as well as in the left insula and amygdala.
Although the results seen in IDPs of grey matter thickness seemed to indicate that the left hemisphere is more strongly associated with SARS-CoV-2 infection, direct (left–right) comparisons of all lateralised IDPs of thickness across the entire cortex showed no overall statistical difference between the two groups (lowest PFWE = 0.43, with no significant results after FDR correction).
Cognitive results
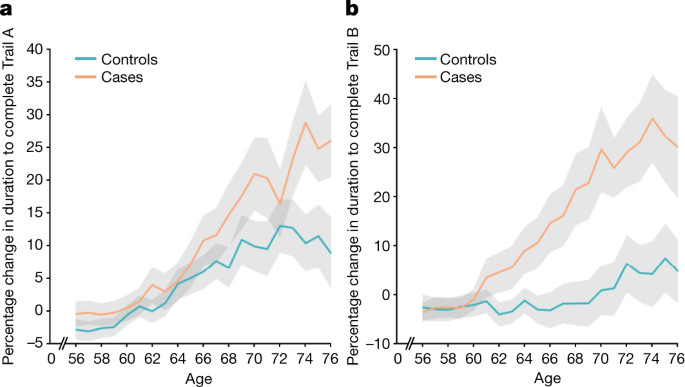
Using the main model used to compare longitudinal imaging effects between SARS-CoV-2-positive participants and controls (Model 1), we explored differences between the two groups in ten scores from six cognitive tasks. These ten scores were selected using a data-driven approach based on out-of-sample participants who are the most likely to show cognitive impairment (Supplementary Analysis 2). After FDR correction, we found a significantly greater increase in the time taken to complete trails A (numeric) and B (alphanumeric) of the Trail Making Test in the group with SARS-CoV-2 infection (trail A: 7.8%, Puncorr = 0.0002, PFWE = 0.005; trail B: 12.2%, Puncorr = 0.00007, PFWE = 0.002; Fig. 3). These findings remained significant when excluding the 15 hospitalised cases (Model 2: trail A: 6.5%, Puncorr = 0.002, PFWE = 0.03; trail B: 12.5%, Puncorr = 0.00009, PFWE = 0.002).
In the SARS-CoV-2 group only, post hoc associations between the most significant cognitive score showing longitudinal effect using Model 1 (duration to complete trail B, as reported above) and the top 10 results from each of the hypothesis-driven and exploratory approaches revealed a significant longitudinal association with the volume of the mainly cognitive lobule crus II of the cerebellum (r = −0.19, PFWE = 0.020).
Additional baseline investigations
When looking at binary baseline differences between controls and individuals who were later infected, none of the IDPs with significant longitudinal effects for either the hypothesis-driven or the exploratory approach demonstrated significant differences at baseline between the two groups (lowest PFWE = 0.59, none were significant after FDR correction; Supplementary Table 2). When applying age modulation in the two-group modelling of IDPs at baseline, a few of the IDPs demonstrated significant differences between the control and future SARS-CoV-2 groups, mainly for diffusion indices in the olfactory functional networks, as well as in the subcortical grey matter. As some IDPs cover spatially extended regions of the brain, we visually examined whether these baseline differences had any spatial overlap with our longitudinal results, but found none (Supplementary Fig. 2). The full list of binary and age-modulated results from group comparisons between the two groups at baseline is available in Supplementary Table 2 (and separately, at the second time point, in Supplementary Table 3). We also provide the scatter plots and box plots, as well as the percentage changes with age at baseline for the top 10 significant longitudinal IDPs from the hypothesis-driven and exploratory approaches (Supplementary Information, Baseline Plots).
Furthermore, none of the 10 preselected cognitive variables showed a significant difference at baseline between the group with SARS-CoV-2 and the control group (minimum Puncorr = 0.08). With age modulation, only one cognitive score—time to complete pairs matching round—showed a trend difference at baseline (Puncorr < 0.05, PFWE = 0.29, not significant after FDR correction). This is a different cognitive score from the one showing longitudinal cognitive effects between the two groups—the UK Biobank Trail Making Test.
We also repeated the main analysis modelling for those top 10 IDPs that were found to show longitudinal differences between the group with SARS-CoV-2 and the control group, across both hypothesis-driven and exploratory approaches. For each of the 6,301 non-imaging variables available (see the ‘Additional analyses—baseline group comparisons’ section in the Methods), we included that variable as an additional confounder in the longitudinal analyses. On the basis of the regression Z-statistic values, the strength of the original associations was not reduced by more than 25% for any of the non-imaging variables.
We further carried out the same analyses, but using dimension reduction (principal component analysis) applied to these 6,301 non-imaging phenotypes (d = 1 to d = 700), and also focussing only on cognition, with 540 cognitive variables (d = 10). We found no substantial reduction in our longitudinal results with any of these principal components. In particular, for cognition in which two components were significantly different at baseline (PC1 and PC4; Supplementary Analysis 1), the strongest reduction in Z was found for crus II of the cerebellum when adding PC1 to the model, with a decrease in Z of only 5.7% (from Z = 4 to Z = 3.77), whereas the Z values associated with all of the other IDPs were reduced by less than 5%. Adding PC4 to our main model reduced Z by 0.4% at most.
Longitudinal effects of pneumonia and influenza
To investigate whether pneumonia might have had an impact on our longitudinal findings, we assessed the age-modulated effects associated with pneumonia in an out-of-sample UK Biobank cohort that had been scanned twice. We identified 11 participants who contracted pneumonia not related to COVID-19 between the two scans, matched these to 261 controls and applied our main analysis (Model 1) to these two groups. This longitudinal investigation showed some significant group differences in IDPs, but with no overlap with those IDPs that we found for SARS-CoV-2 (all in the white matter; Supplementary Analysis 3). Overall, the correlation between the (unthresholded) Z-statistics of all of the IDPs from pneumonia and SARS-CoV-2 longitudinal group comparisons was very low (r = 0.057).
The sample size of cases who contracted influenza between the two scans in the out-of-sample UK Biobank cohort was unfortunately much smaller (n = 5, including n = 3 hospitalised cases), likely due to the low probability of influenza being recorded by a medical professional (GP or hospital). Nevertheless, for completeness, we also assessed longitudinally these two very small groups, compared with 127 matched controls. No result was significant for the 5 influenza cases, although a few IDPs showed significant longitudinal age-modulated effects, with just one IDP in the brainstem common to the SARS-CoV-2 findings (Supplementary Analysis 4). Correlation of Z-statistics between influenza and SARS-CoV-2 longitudinal group comparisons was again low (r = 0.077).
Discussion
This is to our knowledge the first longitudinal imaging study of SARS-CoV-2 in which the participants were initially scanned before any of them had been infected. Our longitudinal analyses revealed a significant, deleterious impact associated with SARS-CoV-2. This effect could be seen mainly in the limbic and olfactory cortical system, for example, with a change in diffusion measures—proxies for tissue damage—in regions that are functionally connected to the piriform cortex, olfactory tubercle and anterior olfactory nucleus, as well as a more pronounced reduction of grey matter thickness and contrast in the participants infected with SARS-CoV-2 in the left parahippocampal gyrus and lateral orbitofrontal cortex. Although the greater atrophy for the participants who tested positive for SARS-CoV-2 was localised to a few, mainly limbic, regions, the increase in CSF volume and decrease in whole-brain volume suggests an additional diffuse loss of grey matter superimposed onto the more regional effects observed in the olfactory-related areas. Note that these structural and microstructural longitudinal significant differences are modest in size—the strongest differences in changes observed between the SARS-CoV-2-positive and control groups, corresponding to around 2% of the mean baseline IDP value (Supplementary Table 1). This additional loss in the infected participants of 0.7% on average across the olfactory-related brain regions—and specifically ranging from 1.3% to 1.8% for the FreeSurfer volume of the parahippocampal/perirhinal and entorhinal cortex—can be helpfully compared with, for example, the longitudinal loss per year of around 0.2% (in middle age) to 0.3% (in older age) in hippocampal volume in community-dwelling individuals31. Our statistics also represent an average effect; not every infected participant will display longitudinal brain abnormalities. Comparing the few patients (n = 15) who had been hospitalized with COVID-19 against non-hospitalized cases showed a more widespread pattern of a greater reduction in grey matter thickness in the fronto-parietal and temporal regions (Fig. 2). Finally, significantly greater cognitive decline, which persisted even after excluding the hospitalized patients, was observed in the SARS-CoV-2-positive group between the two time points, and this decline was associated with greater atrophy of crus II—a cognitive lobule of the cerebellum.
Much has been made of the benefit of using a longitudinal design to estimate, for example, trajectories of brain ageing and cognitive decline32,33. The longitudinal nature of the UK Biobank COVID-19 re-imaging study, with the baseline scan acquired before infection by SARS-CoV-2 and the second scan after infection, reveals differences over time above and beyond any potential baseline differences, thereby helping to disentangle the direct or indirect contribution of the pathogenic process from pre-existing differences in the brain, or risk factors, of future patients with COVID-19. An illustrative example of the benefit of a longitudinal design is that, if looking solely at cross-sectional group comparisons at the second time point after infection (that is, the analysis that would, by necessity, be carried out in post hoc studies), the strongest effect is observed in the volume of the thalamus. However, this effect disappears when taking into account the baseline scans, as the thalamus of the participants who were later infected appears to already differ from the control participants years before infection. This highlights the difficulties in interpreting cross-sectional post-infection imaging differences as being necessarily the consequence of the infection itself. When looking at brain imaging baseline differences between the two groups across all IDPs, particularly in an age-modulated manner, we did find a few further significant baseline differences beyond the volume of the thalamus (Supplementary Table 2). These were principally using diffusion imaging, but also using grey matter volume in the subcortical structures. Importantly, none of these baseline imaging differences spatially overlapped with the regions that were found to be different longitudinally (Supplementary Fig. 2). However, as this study is observational, as opposed to a randomized interventional study, one cannot make claims of disease causality with absolute certainty, but interpretational ambiguities are greatly reduced compared with post hoc cross-sectional studies. The question remains as to whether the two groups are actually perfectly matched, as controls and cases could not be randomized a priori. Across the main risk factors, as well as thousands of lifestyle, health data and environment variables available in UK Biobank, we did not identify any significant differences when looking at each variable in isolation (only a few variables showed some trends at Puncorr < 0.001; Supplementary Table 4). This does not preclude the possibility of a subthreshold pattern of baseline differences making one group more at risk of being infected by SARS-CoV-2, and this risk perhaps interacting with the effects of the coronavirus. This motivated the use of principal component analyses, which revealed two significant components suggesting subtle lower cognitive abilities in the participants who were infected later on (Supplementary Analysis 1). Importantly, neither of these two cognitive components had any bearing on our longitudinal imaging results (reducing at most the strength of Z-statistics from Z = 4 to Z = 3.77 for crus II of the cerebellum, when added in as an extra confound to the longitudinal analysis). Whether any of these imaging and cognitive differences at baseline had a subsequent role in those patients being more likely to be infected by the coronavirus, or to develop symptoms from infection, needs further investigation.
Our cohort-based, quantitative imaging study, in contrast to the majority of single-case and case-series studies published so far, does not focus on gross abnormalities that could be observed at the single-participant level with the naked eye, such as microhemorrhages or (sub)acute ischemic infarctions9. However, it does rely on an anatomically consistent pattern of abnormalities caused by the disease process, a common spatial distribution of these pathological alterations across the infected participants, which could be uncovered by aligning all of the images together in a common space, followed by applying a pipeline of modality-specific image-processing algorithms. This automated, objective and quantitative processing of the images facilitates the detection of subtle changes that would not be visible at the individual level, but which point to a possible mechanism for the neurological effects of the coronavirus infection. Our hypothesis-driven analyses revealed a clear involvement of the olfactory cortex, which was also found in the exploratory analyses and the vertex-wise and voxel-wise maps of cortical thickness and mean diffusivity. Although no differences were seen in the olfactory bulbs or piriform cortex per se (both of which are located in a region above the sinuses that is prone to susceptibility distortions in the brain images, and both are difficult to segment in MRI data), we identified significant longitudinal differences in a network of regions that is functionally connected to the piriform cortex, mainly consisting of the anterior cingulate cortex and orbitofrontal cortex, as well as the ventral striatum, amygdala, hippocampus and parahippocampal gyrus30. Some of the most consistent abnormalities across hypothesis-driven and exploratory analyses, and all of the group comparisons, were revealed in the left parahippocampal gyrus (Table 4, Fig. 2 and Supplementary Table 1)—a limbic region of the brain that has a crucial, integrative role for the relative temporal order of events in episodic memory34,35,36. Importantly, it is directly connected to the piriform cortex and entorhinal cortex, which are both part of the primary olfactory cortex24,37. Similarly, the orbitofrontal cortex, which we also found was altered in the SARS-CoV-2-positive group, is often referred to as the secondary olfactory cortex, as it possesses direct connections to both the entorhinal and piriform cortex37, as well as to the anterior olfactory nucleus23,30. In fact, in a recent functional connectivity study of the primary olfactory cortex, the orbitofrontal cortex was found to be connected to all four primary olfactory regions investigated (frontal and temporal piriform cortex, anterior olfactory nucleus and olfactory tubercle), possibly explaining why it is reliably activated even in basic and passive olfactory tasks30. Using the same olfactory connectivity maps, which overlap cortically in the orbitofrontal cortex, anterior cingulate cortex and insula, we found a more pronounced increase in diffusion metrics indicative of tissue damage in the SARS-CoV-2 group. The voxel-wise map of mean diffusivity revealed that these longitudinal differences were located in the orbitofrontal and anterior cingulate cortex, as well as in the insula and the amygdala. The insula is not only directly connected to the primary olfactory cortex23, but is also considered to be the primary gustatory cortex. ‘Area G’ (that is, the dorsal part of the insula at the junction with the frontal and parietal operculum), in turn, connects with the orbitofrontal cortex38. The vertex-wise and voxel-wise visualisation of both greater loss of grey matter and increase in mean diffusivity in the insula spatially correspond in particular to the area of consistent activation to all basic taste qualities39. Finally, the exploratory analysis revealed a more pronounced loss of grey matter in crus II, part of the cognitive and olfactory-related lobule VII of the cerebellum40. These results are consistent with previous post-infection PET findings showing, in more severe cases, FDG hypometabolism in the insula, orbitofrontal and anterior cingulate cortex, as well as lower grey matter volume in the insula and hippocampus41,42.
Early neurological signs in COVID-19 include hyposmia and hypogeusia, which appear to precede the onset of respiratory symptoms in the majority of affected patients2,20,43. Furthermore, a heavily debated hypothesis has been that an entry point of SARS-CoV-2 to the central nervous system is through the olfactory mucosa, or the olfactory bulb2,11,20 (the coronavirus itself would not necessarily need to enter the central nervous system; anterograde degeneration from olfactory neurons might suffice to generate the pattern of abnormalities revealed in our longitudinal analyses). The predominance observed in other studies of hyposmic and anosmic symptoms—whether caused directly by loss of olfactory neurons or by perturbation of supporting cells of the olfactory epithelium17,22—could also, through repeated sensory deprivation, lead to a loss of grey matter in these olfactory-related brain regions. A highly focal reduction in grey matter in the orbitofrontal cortex and insula has been observed, for example, in patients with severe olfactory dysfunction in a cross-sectional study of chronic rhinosinusitis29. A more extensive study of congenital and acquired (post-infectious, chronic inflammation due to rhinosinusitis or idiopathic) olfactory loss also demonstrated an association between grey matter volume and olfactory function in the orbitofrontal cortex19. It also showed that the duration of olfactory loss for those with acquired olfactory dysfunction, ranging from 0 to over 10 years, was related to a more pronounced loss of grey matter in the gyrus rectus and orbitofrontal cortex19. By contrast, it has been reported in a longitudinal study that patients with idiopathic olfactory loss had higher grey matter volume after undergoing olfactory training in various brain regions including the orbitofrontal cortex and gyrus rectus44. This raises the interesting possibility that the pattern of longitudinal abnormalities observed here in the limbic, olfactory brain regions of SARS-CoV-2-positive participants,if they are indeed related to olfactory dysfunction, might be attenuated over time if the infected participants go on to recover their sense of smell and taste. For example, there is some very preliminary evidence, in a few previously hospitalised patients with COVID-19, that brain hypometabolism becomes less pronounced when followed up 6 months later, even if it does not entirely resolve41,45. In our milder cohort, structural (as opposed to functional) changes might take longer and require larger numbers to be detected. When we tested whether the time between infection and the second brain scan had any relationship—positive, indicative of recovery, or negative, indicative of an ongoing degenerative process—with the grey matter loss or increase in diffusivity in the significant IDPs, we found no significant effect. This result is also possibly due to the relatively small range in the interval between infection and second brain scan at the time of this study—between 1 and 13 months for those 351 infected participants for whom we had a diagnosis date and, particularly, less than 20% of these participants had been infected more than 6 months prior to their second scan (Supplementary Fig. 3). Another source of variability is that each individual in our cohort was infected between the months of March 2020 and April 2021, periods that saw various dominant strains of SARS-CoV-2. Of those 351 participants for whom we have a proxy date of infection, but no formal way of assessing the strain responsible for the infection, a small minority of the participants were probably infected with the original strain, and a majority with the variants of concern present in the UK from October 2020 onwards (predominantly Alpha, but also Beta and Gamma), while presumably very few participants, if any, were infected with the Delta variant, which appeared in the UK in April 2021. As the second scans were acquired over a relatively short period in these positive participants (February–May 2021), SARS-CoV-2 strains and the time between infection and second scan are also highly collinear. Additional follow-up of this cohort, not only increasing the number of cases that became infected 6 months or longer before their second scan, but also including individuals infected by the Delta variant, would be particularly valuable in determining the longer-term effects of infection on these limbic structures, as well as possible differential effects between the various strains.
Various possible explanations for our longitudinal brain results are provided in the Supplementary Discussion.
Many of our results were found using imaging biomarkers of grey matter thickness or volume, which can be sensitive markers of a neurodegenerative process compared with other imaging modalities46, and are robust measurements that makes them ideal in a longitudinal setting47. In fact, the longitudinal differences between the SARS-CoV-2-positive and control groups, although significantly localized in a limbic olfactory and gustatory network, seemed also—at a lower level—to be generalized, as illustrated by the significant shift in the distribution of Z values over the entire cortical surface (Supplementary Fig. 4). This means that there is an overall stronger decrease in grey matter thickness across the entire cortex in the infected participants, but that this effect is particularly dominant in the olfactory system. A marked atrophy of fronto-parietal and temporal regions can also be seen when contrasting hospitalized and non-hospitalized cases, suggesting that there is increased damage in the less mild cases, with an additional significant shift in Z values (Supplementary Fig. 4). The pattern of loss of grey matter in the hospitalized patients compared with the milder cases is consistent with PET-FDG reports showing fronto-parietal and temporal decrease in glucose in hospitalized patients with COVID-1918,45.
The overlapping olfactory- and memory-related functions of the regions shown to alter significantly over time in SARS-CoV-2—including the parahippocampal gyrus/perirhinal cortex, entorhinal cortex and hippocampus in particular (Supplementary Table 1)—raise the possibility that longer-term consequences of SARS-CoV-2 infection might in time contribute to Alzheimer’s disease or other forms of dementia2. This has led to the creation of an international consortium including the Alzheimer’s Association and representatives from more than 30 countries to investigate these questions2. In our sample of participants who mainly had mild infection, we found no signs of memory impairment. However, these participants who tested positive for SARS-CoV-2 showed a worsening of executive function, taking a significantly greater time to complete trail A and particularly trail B of the Trail Making Test (Fig. 3). These findings remained significant after excluding the few hospitalized cases. Although the UK Biobank version of the Trail Taking Test is carried out online and unsupervised, there is good to very good agreement with the standard paper-and-pencil Trail Making Test on its measurements for completion of the two trails48, two measures that are known to be sensitive to detect impairment of executive function and attention, for example, in affective disorders and in schizophrenia49,50, and to discriminate mild cognitive impairment and dementia from healthy ageing51. In turn, the duration to complete the alphanumeric trail B was associated post hoc with the longitudinal changes in the cognitive part of the cerebellum, namely crus II, which is also specifically activated by olfactory tasks40,52. Consistent with this result, this particular part of the cerebellum has been recently shown to have a key role in the association with (and prediction of future) cognitive impairment in patients with stroke (subarachnoid hemorrhage)53. By contrast, the parahippocampal gyrus and other memory-related regions did not show in our study any alteration at a functional level, that is, any post hoc association with the selected cognitive tests. It remains to be determined whether the loss of grey matter and increased tissue damage seen in these specific limbic regions may in turn increase the risk for these participants of developing memory problems54, and perhaps dementia in the longer term2,4,55.
The limitations of this study include a lack of stratification of the severity of the cases, beyond the information of whether they had been hospitalized (information on O2 saturation levels and details of treatment or hospital procedures is currently available for only a few participants); a lack of clinical correlates as they are not currently available as part of the UK Biobank COVID-19-related links to health records (of particular relevance, potential hyposmic and hypogeusia symptoms and blood-based markers of inflammation); a lack of identification of the specific SARS-CoV-2 strain that infected each participant; a small number of participants from Asian, Black or other ethnic background other than white; and some of the cases’ and controls’ SARS-CoV-2 infection status was identified using antibody lateral flow test kits that have varied diagnostic accuracy56. However, note that any potential misclassification of controls as positive cases (due to false positives in testing) and positive cases as controls (due to the absence of confirmed negative status and/or false negative tests) could only bias our results towards the null hypothesis of no difference between cases and controls. For cases, no distinction is possible at present to determine whether a positive test is due to infection or vaccination, so potential cases identified only through lateral flow test in vaccinated participants were not included in this study. Information on the vaccination status, and how both vaccination dates might interact with the date of infection, is also currently unavailable. Although the two groups were not significantly different across major demographic and risk-factor variables, we identified a subtle pattern of lower cognitive abilities in the participants who went on to be infected, but this could not explain away our longitudinal findings. The individuals who were later infected also showed a lower subcortical volume, and higher diffusion abnormalities at baseline compared with the control individuals, in brain regions that did not overlap with our longitudinal results. One issue that is inherent to the recruitment strategy of UK Biobank, based on participants volunteering after being contacted at home for a possible re-imaging session, is the high number of mild cases. However, this can be seen as a strength of this study: the majority of the brain imaging publications to date have focused on moderate to severe cases of COVID-199; there is therefore a fundamental need for more information on the cerebral effects of the disease in its milder form. The UK Biobank COVID-19 re-imaging study is ongoing, and further information will eventually be made available. For the statistical approach, we chose a model form given strong priors of highly increased detrimental effects of SARS-CoV-2 and greater vulnerability of the brain with age. Using this objective model and rigorous statistical inference, we found significant and interpretable results. We have not tested all possible models for all of the possible IDPs; instead, we focused on one possible model drawn from independent, existing literature and found that it is useful, that is, statistically significant. The model may not be optimal for every feature considered; in other words, this model might not be the most sensitive possible model for every IDP. However, the main expected outcome of using a suboptimal model would be that we would fail to find significant results, and not that there would be any inflation of false-positive results. Finally, on the imaging side, our exploratory approach revealed significant longitudinal differences in the volume of the whole brainstem, but the UK Biobank scanning protocol and processing does not allow us to clarify which specific nuclei (for example, potentially those that are key autonomic and respiratory control centres) might be involved, with the exception of the substantia nigra.
This is to our knowledge the first longitudinal imaging study comparing brain scans acquired from individuals before and after SARS-CoV-2 infection with those scans from a well-matched control group. It also is one of the largest COVID-19 brain imaging studies, with 785 participants including 401 individuals infected by SARS-CoV-2. Its unique design makes it possible to more confidently tease apart the pathogenic contribution associated, directly or indirectly, with the infection from pre-existing risk factors. By using automated, objective and quantitative methods, we uncovered a consistent spatial pattern of longitudinal abnormalities in limbic brain regions forming a mainly olfactory network. Whether these abnormal changes are a hallmark of the spread of the pathogenic effects, or of the virus itself in the brain, and whether these abnormalities may indicate a future vulnerability of the limbic system in particular, including memory, for these participants remains to be investigated.