
Lawrence Purpura , Thomas Heisler , Steven Palmer , et. al. linical Infectious Diseases, ciaf624, https://doi.org/10.1093/cid/ciaf62
Abstract
Background
Postacute sequelae of COVID-19 (PASC), also known as long COVID, and postacute COVID-19 vaccination syndrome (PACVS) present overlapping but distinct clinical challenges. We hypothesize that PASC and PACVS share clinical features but differ in symptom patterns and biomarker profiles. This study aims to identify differences in presentation and distinguish immunologic biomarkers relevant to general clinical practice.
Methods
This cross-sectional study analyzed 181 patients from a PASC clinic at Columbia University Irving Medical Center. Patients were divided into PASC with myalgic encephalomyelitis/chronic fatigue syndrome (MECFS), PASC without MECFS (LC), and PACVS groups. Prevalence and severity of self-reported symptoms, as well as immunologic abnormalities, were compared across groups.
Results
Fatigue was the most common symptom (Total: 88.95%; MECFS: 100.00%; PACVS: 92.86%; LC: 78.05%). The MECFS group generally reported more symptoms across all organ systems. The PACVS group reported higher rates of atypical chief complaints such as peripheral neuropathy (17.9%), tinnitus (7.1%), and rash (10.7%) compared to the other groups (P = <.01). Functional impairment was comparable between the MECFS and PACVS groups and less severe in the LC group. All groups had high rates of autoantibody positivity and cytokine elevation. The PACVS group showed significantly higher rates of anticardiolipin IgM (PACVS 42.9%, LC 11.6%; P = .02) and anti-U1-RNP (PACVS 21.4%, LC 2.3%; P = .04) positivity compared to the LC group.
Conclusions
PASC and PACVS share symptom overlap but exhibit distinct biomarker patterns, particularly elevated autoantibody levels in PACVS. These findings suggest autoimmune involvement, warranting further investigation for targeted therapies.
Graphical Abstract
This graphical abstract is also available at Tidbit: https://tidbitapp.io/institutional-portal/clinical-infectious-diseases/tidbits/overlapping-clinical-presentation-of-long-COVID-and-post-acute-COVID-19-vaccination-syndrome-phenotypes-severity-and-biomarkers/update
long COVID, postacute sequelae of COVID-19 (PASC), postacute COVID-19 vaccination syndrome (PACVS), myalgic encephalomyelitis/chronic fatigue syndrome (ME-CFS), autoimmunity
Topic:
- chronic fatigue syndrome
- autoimmunity
- biological markers
- immunology
- covid-19
- covid-19 vaccines
- post-acute covid-19 syndrome
The COVID-19 pandemic has led to an unprecedented public health challenge, with a significant portion of individuals experiencing persistent symptoms following acute infection. Postacute sequelae of COVID-19 (PASC), often referred to as long COVID, is defined as having symptoms that persist for at least 3 months [1]. The putative etiology of PASC is likely multifactorial, and leading mechanistic theories include immune dysregulation, autoimmunity, endothelial dysfunction, viral persistence, and reactivation of latent viruses [2].
PASC presents with symptoms across various organ systems. Neuropsychiatric sequelae are most common, overlapping with other syndromes such as myalgic encephalomyelitis chronic fatigue syndrome (MECFS), postural orthostatic tachycardia syndrome (POTS), cognitive dysfunction, and neuropathy. The widely used Institute of Medicine (IOM) definition for MECFS is rigorous and highly specific for MECFS. The NIH RECOVER initiative reported that while 39.8% of COVID-infected participants had at least one MECFS symptom, only 4.5% met MECFS criteria [3]. PASC patients meeting MECFS criteria may represent a more severe phenotype within a spectrum of clinical severity.
Postacute COVID-19 vaccination syndrome (PACVS) has significant overlap with PASC in clinical presentation, with chronic fatigue, peripheral neuropathy, and cognitive impairment reported as the most common symptoms [4–6]. Autoantibodies to a wide array of neuronal, endothelial, and nuclear antigens have been reported in both PACVS and PASC; however, most of these autoantibody tests are limited to research assays and are not available for clinical care [7–12].
Multidisciplinary clinics focused on infection-associated chronic illness (IACI) play an essential role in providing clinical care for both PASC and PACVS. Recent publications describing IACI clinic experiences have highlighted clinical phenotypes, limited complete recovery, female predominance, and the disproportional impact on young and middle-aged adults in PASC [13–15] and PACVS [4, 5].
We present a cross-sectional analysis of sequentially enrolled patients seen in a dedicated IACI clinic to compare phenotypic presentations, disease severity, and immunologic labs to explore potential overlap and differences across PASC patients meeting and not meeting criteria for MECFS, and PACVS.
METHODS
Data Source and Study Sample
The electronic medical records (EMRs) of 202 patients seen in the Columbia University Irving Medical Center (CUIMC) IACI Clinic between 15 January 2021 and 12 December 2024 were examined. All patients were 18 years or older with a diagnosis of either PASC or PACVS made by experienced clinic providers in accordance with National Academies of Sciences, Engineering, and Medicine definitions [1]. Clinical and laboratory data were abstracted from the EMR into a REDCap database (Research Electronic Data Capture) instrument. The study protocol was approved by the CUIMC Institutional Review Board (approval no. AAAV2022).
Manual Chart Review
Demographic and medical history were abstracted from the demographics section, problem list and history listed in clinic provider notes with the EMR. Clinical data such as symptoms and functional limitations were abstracted from provider notes and previsit questionnaires obtained at the initial clinic visit only. (see Data Abstraction Tool—Initial Visit Data)
Lab data were abstracted from a comprehensive review of labs sent by CUIMC IACI clinic providers (see Data Abstraction Tool—Initial Visit Labs and Data Abstraction Tool—Follow-up data). The scope of the typical lab work-up sent at clinic visits expanded over time due to emerging research and changing practices; therefore, results from labs sent at both initial and follow-up visits were included to maximize the sample sizes for the lab data analysis. As such, not all lab results included in the analysis were drawn and recorded at the time of the initial clinic evaluation.
Definitions
Acute COVID severity was determined using pre-visit questionnaires and clinic provider notes and classified based on Infectious Diseases Society of America (IDSA) Guidelines on the Treatment and Management of Patients with COVID-19 [16]. Only the severity of the initial acute COVID infection was included.
A complete list of PASC/PACVS symptoms was generated for each patient based on responses to the review of systems in the pre-visit questionnaire. Chief complaint was determined as the patient’s most debilitating symptom as noted in the pre-visit questionnaire or provider notes.
MECFS status was defined based on responses to validated MECFS screening questions in the pre-visit questionnaire. The MECFS screen was considered positive based on the IOM 2015 diagnostic criteria: substantial reduction in pre-illness levels of activity lasting at least 6 months, post-exertional malaise, and unrefreshing sleep, with at least one of the following additional symptoms: cognitive impairment or orthostatic intolerance [17].
Functional status was determined using 2 methods: patient-reported percentage of preillness health found in the previsit questionnaire and patient responses to the Post-COVID Functional Status Scale in the previsit questionnaire (see Previsit Questionnaire).
A patient was considered to have an abnormal lab result if the lab was outside of reference range in the EMR at any point during their clinic course (initial or follow-up visit). Clinic labs were obtained through CUIMC’s laboratory, Lab Corp or Quest Diagnostics.
Data Analysis
Descriptive analyses of demographics, symptom severity, chief complaint, and symptom frequency were limited to data from the initial clinic visit only. Analysis of laboratory results included data from both the initial visit and follow-up visits. Lab abnormality rate was defined as the number of patients with a positive result at any point in their clinic course divided by the total number patients in the sample/subgroup. For categorical variables, frequency counts and proportions were calculated. For continuous variables, median and IQR were calculated. Fisher’s exact test was used for all comparisons between categorical variables. ANOVA was used for all comparisons between continuous variables.
A Firth’s logistic regression analysis was performed to confirm statistically significant differences between groups when controlling for age, sex, race, ethnicity, and prior history of autoimmunity. Z-score analyses were performed for biomarkers with significant between-group differences in categorical testing, using cohort-wide means and standard deviations as a reference, and tested with the Kruskal–Wallis method. A threshold of P ≤ .05 was used to determine statistical significance.
RESULTS
Sample Selection
Patients were stratified into three groups: long COVID MECFS positive (MECFS), PACVS, and long COVID MECFS negative (LC) based on clinic provider and questionnaire assessment as outlined in the Methods section. Of the patients included in the chart review, 28 were identified as PACVS, 71 as MECFS, and 82 as LC, for a total sample of 181 patients (Supplementary Figure 1A). Of the 202 records reviewed, 21 were excluded due to a lack of MECFS screening at the initial visit (Supplementary Figure 1A). For each PACVS patient, a timeline of vaccination and symptom onset was created (Supplementary Figure 2) to demonstrate a temporal association: mean time of symptom onset was 5 days (range: 0–33 days, standard deviation: 9 days) after vaccination (Supplementary Table 1). Similarly, LC and MECFS groups exhibited a temporal association following a SARS-CoV-2 infection: LC (mean: 11 days, range: 0–92, standard deviation: 21) and MECFS (mean: 9 days, range 0–68, standard deviation 16).
Sample Characteristics
Overall, there were no significant differences in demographic identifiers between groups (Table 1). Median age of the total sample was 43 (Table 1). The proportion of females was larger than that of males in the total cohort (65.1% female, 34.3% male) and across each subgroup (Table 1). The majority of initial visits occurred in 2023 (38.1%) and 2024 (39.8%).
Table 1.
Full Sample and Subgroup Characteristics
| MECFS | PACVS | LC | Total | P Value | |
|---|---|---|---|---|---|
| N = 71 | N = 28 | N = 82 | N = 181 | ||
| Age, median (IQR) | |||||
| 41 (33–56) | 46 (38.8–64.5) | 44.5 (34–60) | 43 (34–60) | .20 | |
| Sex, n (%) | |||||
| Male | 22 (31.0) | 10 (35.7) | 30 (36.6) | 62 (34.3) | .34 |
| Female | 49 (69.0) | 17 (60.7) | 52 (63.4) | 118 (65.2) | |
| Intersex | 0 (0.0) | 1 (3.6) | 0 (0.0) | 1 (0.6) | |
| Race, n (%) | |||||
| White | 43 (60.6) | 15 (53.6) | 53 (64.6) | 111 (61.3) | .66 |
| African American/Black | 2 (2.8) | 0 (0.0) | 5 (6.1) | 7 (3.9) | |
| Asian | 5 (7.0) | 2 (7.1) | 4 (4.9) | 11 (6.1) | |
| Native Hawaiian or other Pacific Islander | 1 (1.4) | 0 (0.0) | 0 (0.0) | 1 (0.6) | |
| Other combinations not described | 20 (28.2) | 11 (39.3) | 20 (24.4) | 51 (28.2) | |
| Ethnicity, n (%) | |||||
| Hispanic | 11 (15.5) | 1 (3.6) | 9 (11.0) | 21 (11.6) | .33 |
| Not Hispanic | 49 (69.0) | 19 (67.9) | 60 (73.2) | 128 (70.7) | |
| Not specified | 11 (15.5) | 8 (28.6) | 13 (15.9) | 32 (17.7) | |
| BMI, median (IQR) | |||||
| 25 (21.0–30.2) | 22.6 (20.8–25.6) | 23.6 (21.2–27.6) | 24 (21.0–27.8) | .13 | |
| Comorbiditiesa, n (%) | |||||
| Cardiovascular | |||||
| Hypertension | 6 (8.5) | 5 (17.9) | 16 (19.5) | 27 (14.9) | .13 |
| Coronary artery disease | 2 (2.8) | 0 (0.0) | 7 (8.5) | 9 (5.0) | .16 |
| Neuropsychiatric | |||||
| Depression | 12 (16.9) | 5 (17.9) | 13 (15.9) | 30 (16.6) | .96 |
| Migraine | 12 (16.9) | 5 (17.9) | 10 (12.2) | 27 (14.9) | .66 |
| Anxiety | 7 (9.9) | 3 (10.7) | 10 (12.2) | 20 (11.0) | .95 |
| Gastrointestinal | |||||
| Irritable Bowel Syndrome | 4 (5.6) | 0 (0.0) | 6 (7.3) | 10 (5.5) | .47 |
| Pulmonary | |||||
| Asthma | 11 (15.5) | 2 (7.1) | 12 (14.6) | 25 (13.8) | .62 |
| Endocrine | |||||
| Hypothyroidism | 3 (4.2) | 2 (7.1) | 8 (9.8) | 13 (7.2) | .42 |
| Other | |||||
| Malignancy | 7 (9.9) | 1 (3.6) | 5 (6.1) | 13 (7.2) | .58 |
| Connective tissue disorder | 3 (4.2) | 2 (7.1) | 3 (3.7) | 8 (4.4) | .79 |
| History of autoimmunitya, n (%) | |||||
| Yes | 12 (16.9) | 8 (28.6) | 16 (19.5) | 36 (19.9) | .42 |
| No | 59 (83.1) | 20 (71.4) | 66 (80.5) | 145 (80.1) | |
| Acute COVID, n (%) | |||||
| Number of infections | |||||
| 0 | 0 (0.0) | 17 (60.7) | 0 (0.0) | 17 (9.4) | <.01 |
| 1 | 40 (56.3) | 9 (32.1) | 52 (63.4) | 101 (55.8) | |
| 2 | 20 (28.2) | 2 (7.1) | 20 (24.4) | 42 (23.2) | |
| 3 | 6 (8.5) | 0 (0.0) | 8 (9.8) | 14 (7.7) | |
| 4 | 5 (7.0) | 0 (0.0) | 2 (2.4) | 7 (3.9) | |
| Acute COVID-19 severityb | |||||
| Mild | 30 (42.3) | 4 (14.3) | 41 (50.0) | 75 (41.4) | <.01 |
| Moderate | 23 (32.4) | 5 (17.9) | 28 (34.1) | 56 (30.9) | |
| Severe | 10 (14.1) | 1 (3.6) | 5 (6.1) | 16 (8.8) | |
| Critical | 3 (4.2) | 0 (0.0) | 2 (2.4) | 5 (2.8) | |
| Severity unknown/no infection | 5 (7.0) | 18 (64.3) | 6 (7.3) | 29 (16.0) |
Abbreviations: LC, PASC without MECFS; MECFS, myalgic encephalomyelitis/chronic fatigue syndrome; PACVS, postacute COVID-19 vaccination syndrome.
aSee Supplementary data (Supplementary Table 2) for full list of medical comorbidities and autoimmune conditions.
bSeverity based on initial infection and on IDSA Guidelines on the Treatment and Management of Patients with COVID-19 [11].
There were no statistically significant differences in comorbidities between groups (Table 1). Depression, hypertension, migraine headaches, and asthma were the four most common comorbidities in the total cohort (Table 1, Supplementary Table 2).
Most of the PASC patients had either 1 (92/153, 60.1%) or 2 (40/153, 26.1%) acute COVID-19 infections (Table 1). Most PASC patients had mild to moderate acute COVID-19 episodes (MECFS: 74.6%, LC: 84.1%); however, the MECFS group had a higher rate of severe-critical acute COVID compared to the LC group (MECFS 18.3%, LC 8.5%) (Table 1).
Of the PASC patients who received a COVID-19 vaccination after the onset of their PASC symptoms and the effect of the vaccine on their PASC symptoms was recorded (n = 77), only 11 (14.3%) reported that COVID-19 vaccination worsened PASC symptoms and 5 patients (6.5%) noted an improvement in PASC symptoms.
The majority of PACVS patients (93.0%) began experiencing symptoms after one of the first three doses in the COVID-19 vaccine series. Nearly all (93%) received an mRNA vaccine, but 2 (7%) received an adenovirus vector vaccine. Based upon the screening tool for MECFS, 13 (46.4%) PACVS patients had symptoms that met criteria.
PASC/PACVS Symptoms
Fatigue was the most reported chief complaint in the full cohort and across each subgroup (Figure 1, Supplementary Table 2). Notably, the PACVS group reported higher rates of atypical chief complaints such as peripheral neuropathy, tinnitus, and rash when compared to the MECFS and LC groups (P = <.01) (Figure 1, Supplementary Table 3).
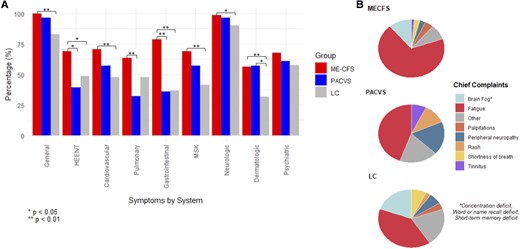
Figure 1.
Symptom distribution of the long COVID positive for MECFS (MECFS), post-acute COVID-19 vaccination syndrome (PACVS), and long COVID negative for MECFS (LC) groups. A, Total symptom frequency by organ system; general: fatigue, weight loss, weight gain, fever, chills, night sweats, sleep disturbance; HEENT: visual disturbance, loss of taste, loss of smell, distorted/altered taste/smell, sore throat, hoarse voice, lymphadenopathy, facial swelling, tongue swelling; cardiovascular: palpitations, chest pain, lower extremity swelling; pulmonary: shortness of breath, cough; gastrointestinal: nausea, vomiting, diarrhea, constipation, heartburn, abdominal discomfort; MSK: arthralgia, myalgia; neurologic: headache, peripheral neuropathy, weakness, short-term memory deficit, word or name recall deficit, concentration deficit, dizziness, lightheadedness, tinnitus, hearing loss, internal tremors/vibration; dermatologic: rash, hair loss, itching; psychiatric: depression, anxiety; (B) Patient-reported most debilitating symptom (chief complaint).
Regarding total symptoms, fatigue was the most reported symptom across all groups, followed by the brain-fog type symptoms of short-term memory deficit, concentration deficit, and word/name recall deficit (Table 2). The MECFS group generally reported significantly higher rates of symptoms across all organ systems, especially when compared to the LC group. (Figure 1). These differences remained significant after controlling for demographic factors using logistic regression. The MECFS group also reported significantly higher frequencies on the individual symptom level, particularly in the neurologic-type symptoms (Table 2, Supplementary Table 3). One notable exception was a significantly higher rate of tinnitus in the PACVS group (P = .01) (Table 2). The PACVS group also had higher rates of hearing loss, rash, internal tremors/vibration, and hair loss; however, these differences did not reach statistical significance (Table 2, Supplementary Table 3).
Table 2.
Individual Symptom Prevalence
| MECFS | PACVS | LC | Total | P Value | |
|---|---|---|---|---|---|
| N = 71 | N = 28 | N = 82 | N = 181 | ||
| Symptomsa, n (%) | |||||
| General | |||||
| Fatigue | 71 (100.0) | 26 (92.9) | 64 (78.0) | 161 (89.0) | <.01 |
| Sleep disturbance | 57 (80.3) | 15 (53.6) | 32 (39.0) | 104 (57.5) | <.01 |
| Cardiovascular | |||||
| Palpitations | 43 (60.6) | 12 (42.9) | 31 (37.8) | 86 (47.5) | .02 |
| Chest pain | 26 (36.6) | 8 (28.6) | 21 (25.6) | 55 (30.4) | .34 |
| Pulmonary | |||||
| Shortness of breath | 43 (60.6) | 9 (32.1) | 34 (41.5) | 86 (47.5) | .01 |
| Gastrointestinal | |||||
| Abdominal discomfort | 36 (50.7) | 6 (21.4) | 15 (18.3) | 57 (31.5) | <.01 |
| Diarrhea | 30 (42.3) | 7 (25.0) | 17 (20.7) | 54 (29.8) | .01 |
| MSK | |||||
| Arthralgia/joint pain | 38 (53.5) | 11 (39.3) | 26 (31.7) | 75 (41.4) | .02 |
| Myalgia/muscle pain | 42 (59.2) | 12 (42.9) | 20 (24.4) | 74 (40.9) | <.01 |
| Neurologic | |||||
| Short term memory deficit | 55 (77.5) | 18 (64.3) | 43 (52.4) | 116 (64.1) | .01 |
| Concentration deficit | 57 (80.3) | 16 (57.1) | 40 (48.8) | 113 (62.4) | <.01 |
| Word or name recall deficit | 54 (76.1) | 14 (50.0) | 43 (52.4) | 111 (61.3) | <.01 |
| Dizziness | 51 (71.8) | 16 (57.1) | 39 (47.6) | 106 (58.6) | .01 |
| Headache | 47 (66.2) | 9 (32.1) | 37 (45.1) | 93 (51.4) | <.01 |
| Peripheral neuropathy | 45 (63.4) | 13 (46.4) | 30 (36.6) | 88 (48.6) | <.01 |
| Lightheadedness | 39 (54.9) | 8 (28.6) | 31 (37.8) | 78 (43.1) | .02 |
| Weakness | 46 (64.8) | 8 (28.6) | 21 (25.6) | 75 (41.4) | <.01 |
| Tinnitus | 28 (39.4) | 16 (57.1) | 22 (26.8) | 66 (36.5) | .01 |
| Psychiatric | |||||
| Anxiety | 44 (62.0) | 15 (53.6) | 41 (50.0) | 100 (55.2) | .33 |
| Depression | 37 (52.1) | 12 (42.9) | 29 (35.4) | 78 (43.1) | .11 |
Bold values are significat at P < 0.05. Abbreviations: LC, PASC without MECFS; MECFS, myalgic encephalomyelitis/chronic fatigue syndrome; PACVS, postacute COVID-19 vaccination syndrome.
aIncludes only top 20 symptoms based on prevalence in the total cohort, see Supplementary data (Supplementary Table 2) for a complete list of symptoms/chief complaints.
Symptom Severity/Functional Limitation
Overall, the MECFS and PACVS groups showed similar levels of symptom severity and functional limitation, while the LC group reported less functional limitation (Figure 2). The distribution of percent preillness health was similar between MECFS and PACVS groups (median 37.5 vs 40, respectively), while the LC patients reported levels closer to their pre-COVID baseline (median 65) (P < .01). (Figure 2A). Additionally, the majority of MECFS and PACVS patients reported moderate to severe functional limitations (MECFS 80.3%, PACVS 70.5%), whereas the majority of LC patients reported negligible to occasional functional limitations (60.0%) (P < .01) (Figure 2B).
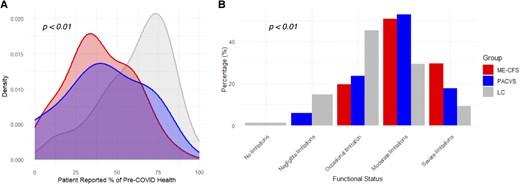
Figure 2.
Patient-reported functional status of the long COVID positive for MECFS (MECFS), post-acute COVID-19 vaccination syndrome (PACVS), and long COVID negative for MECFS (LC) groups based on (A) perceived health level at initial visit compared to perceived health before LC/PACVS (MECFS n = 44; PACVS n = 14; LC n = 59; Total n = 117), and (B) Post-COVID Functional Status Scale (MECFS n = 61; PACVS n = 17; LC n = 75; Total n = 153).
Clinical Lab Results
Of the patients included in the chart review, 92 were selected for the lab analysis (Supplementary Figure 1B). Patients were selected only if each of the following labs had been sent during their clinic course: plasma histamine, tryptase, cytokine panel, HSP-70 antibody western blot (HSP70), antinuclear antibody titer (ANA), quantitative anticardiolipin IgM (ACL), and quantitative ribonucleic protein extranuclear antibody IgG (anti U1-RNP). Of the 92 patients with complete lab work-up, 14 were classified as PACVS, 32 as MECFS, and 43 as LC, for a total of 89 patients (Supplementary Figure 1B). Demographic and comorbidity data for the lab analysis groups are shown in Supplementary Table 4. Overall, no statistically significant differences were seen between groups except for the rate of hypertension (Supplementary Table 4).
The total cohort showed high rates of plasma histamine (42.7%) and cytokine panel abnormalities (60.7%), as well as high rates of HSP70 (22.5%), ACL (18.0%), and U1-RNP (7.9%) autoantibody positivity (Figure 3, Supplementary Table 4). The most commonly abnormal cytokines across all three groups were IL-10 (41.6%), IL-2 receptor (24.7%), and IL-13 (19.1%) (Supplementary Table 4). TNF alpha was elevated in 19% of MECFS and 21% of PACVS patients, and IFN gamma was elevated in 22% of ME-CFS patients. A separate analysis was performed on patients with c-reactive protein (CRP) sent at the initial visit (n = 118). The overall CRP positivity rate was low (6/118, 5.1%) in the full cohort as well as in the MECFS (5/42, 11.9%), PACVS (0/13, 0.0%), and LC (1/63, 1.6%) groups (P = .06).
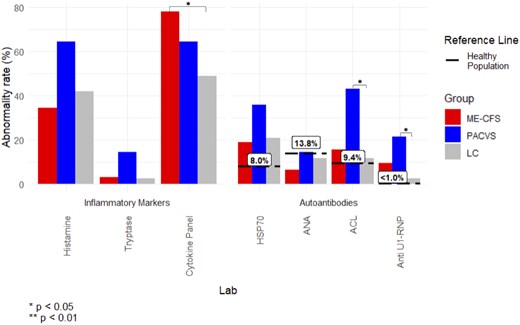
Figure 3.
Clinical lab abnormality rate, as defined by percent of patients with abnormal lab result at anytime (initial visit or follow-up), compared between the long COVID positive for MECFS (MECFS), post-acute COVID-19 vaccination syndrome (PACVS), and long COVID negative for MECFS (LC) groups and previously reported positivity rates in healthy populations. HSP70, HSP-70 antibody western blot; ANA, antinuclear antibody; ACL, quantitative anticardiolipin IgM; anti U1-RNP, quantitative ribonucleic protein extranuclear antibody.
When comparing positivity rates between groups, the MECFS group showed a significantly higher rate of cytokine panel positivity compared to the LC group (MECFS 78.1%, LC 48.8%; P = .02). The PACVS group showed significantly higher rates of ACL (PACVS 42.9%, LC 11.6%; P = .02) and U1-RNP (PACVS 21.4%, LC 2.3%; P = .04) positivity compared to the LC group (Figure 3, Supplementary Table 5). The difference in cytokine panel positivity between MECFS and LC groups (OR 3.14; P = .03) and the difference in U1-RNP positivity between PACVS and LC groups (OR 10.55; P = .03) remained significant after controlling for demographic factors using logistic regression. In confirmatory z-score analysis using cohort-wide means, significant differences were observed for ACL (P = .04) and IFNg (P = .001) (Supplementary Figure 3).
DISCUSSION
Fatigue emerged as the most prevalent chief complaint and reported symptom across all groups (Figure 1), aligning with findings from previous studies on PASC [18] and PACVS [4, 5]. Notably, PACVS patients were more likely to report an atypical symptom as their chief complaint, including peripheral neuropathy, rash, and tinnitus. This may imply that atypical neurologic and allergic phenotypes are more common in PACVS. Mundorf et al similarly reported overlapping phenotypes of ME-CFS, small fiber neuropathy, POTS, and mast cell activation syndrome (MCAS) in PACVS [4]. Conversely, the MECFS group exhibited higher rates of sleep disturbance, palpitations, musculoskeletal, shortness of breath, gastrointestinal, and cognitive symptoms, and headaches compared to the LC and PACVS groups. These observations suggest distinct symptomatology between the two conditions, despite overlapping features, and corroborate prior publications describing PACVS presentations [4, 5].
Regarding disease severity, both the MECFS and PACVS groups reported significant functional limitations, with median perceived preillness health percentages of 37.5% and 40%, respectively, compared to 65% in LC (Figure 2), indicating substantial impairment in daily activities. However, reported symptoms were similar between MECFS and LC groups, which indicates that PASC is a clinical spectrum, with many patients not meeting the rigorous criteria of MECFS, but likely sharing underlying pathophysiology.
Nearly all PACVS patients developed long-term symptoms within the first three doses (Supplementary Figure 2), suggesting a higher risk of PACVS with initial vaccinations. Among PASC patients, only 14% reported worsening of their symptoms after vaccination, while 6.5% reported improvement. Overall, this implies a low risk of symptom exacerbation in patients with pre-existing PASC with subsequent vaccination.
Clinical laboratory analyses revealed an elevation of cytokines and histamine across all groups, consistent with immune dysregulation and possible mast cell activation (Figure 3). CRP, a commonly used clinical screening test for inflammation, was normal in most patients, but potential cytokine signatures were identified across all groups (IL-10, IL-2 receptor, IL-13), and specifically for MECFS (IFN gamma, TNF alpha) and PACVS (TNF alpha). This suggests ongoing immune activation with pro-inflammatory cytokines and a compensatory elevation of anti-inflammatory IL-10, which has been reported in prior PASC studies [19]. Notably, a recent study by Mondorf et al also reported cytokine elevations in PACVS despite normal CRP levels, with IL-6 and IL-8 elevated in 60% and 90% of cases, respectively [4]. Differences in cytokine profiles between studies may reflect variation in cohort composition, timing of sample collection, or laboratory assay platforms, and highlight the need for further investigation.
MCAS, mediated by histamine and tryptase, is suspected to occur in a subset of PASC patients [20, 21]. MCAS can present with common PASC symptoms, such as fatigue, irritable bowel syndrome, and joint pain, but can also lead to flushing, hives, new food and environmental allergies, and anaphylaxis. Elevated tryptase has been reported in acute COVID-19 vaccine-induced anaphylaxis, but the role of MCAS in chronic PACVS remains unknown [22, 23].
The PACVS group had increased autoantibody positivity, including HSP-70, anti-cardiolipin IgM, and U1-RNP antibodies (Figure 3). HSP-70 positivity in the general population has been reported as 5–8% [24, 25], far below the positivity rate in our MECFS and PACVS groups, which was 18.75% versus 35.71%, respectively. Heatshock proteins are normally expressed under physiologic stress and assist with proper protein folding and cell signaling, but also modulate adaptive and innate immunity [24, 26–29]. HSP-70 autoantibody has been reported in autoimmune conditions including dermatitis herpetiformis, celiac disease, rheumatoid arthritis [26], as well as Meniere’s disease and autoimmune sensorineural hearing loss, which may explain the higher rates of inner ear symptoms in PACVS [30, 31].
Seroprevalence of cardiolipin IgM is approximately 9% in the general populations [32], but a high proportion was seen in both PACVS and MECFS groups, 42.86% versus 15.63%, respectively (Figure 3). Cardiolipin antibodies are classically associated with antiphospholipid syndrome and thrombotic complications in autoimmune disease [33]. Cardiolipin IgM and IgG have been reported in acute COVID-19, with persistence in late convalescence [34–36]. The pattern of positive ACL IgM and negative IgG, may be in line with other post-infectious autoimmune diseases with IgM predilection, including cold agglutinin autoimmune hemolytic anemia, cryoglobulinemia, multiple sclerosis, and primary biliary cirrhosis [37].
U1-RNP autoantibody rate was also significantly higher in the PACVS group. U1-RNP is classically associated with systemic lupus erythematosus and mixed connective tissue disease and is pro-inflammatory through immune complex formation and inflammasome activation [38, 39]. U1-RNP is also associated with persistent fatigue and dyspnea in PASC and may indicate ongoing immune activation in PACVS [40].
Taken together, HSP-70, ACL IgM, and U1-RNP may indicate autoimmunity in both PASC and PACVS and may be useful diagnostic tests. Additionally, these autoantibodies have potential utility as biomarkers that are readily available to the general clinician, as opposed to those limited to a research laboratory setting. These findings could also provide a basis for further laboratory investigation such as high-throughput autoantibody discovery and whole blood transcriptomics to assess differences in gene expression. As such, further research is needed to characterize their potential role in PASC and PACVS.
Our study is limited by its retrospective design, reporting only patients from a single IACI clinic, and reliance on chart review, which may be subject to biases. Additionally, the absence of a control group hinders the generalizability of the reported immunologic abnormalities. Future prospective studies on PASC and PACVS with comprehensive immunologic profiling and control groups are necessary to validate these findings.
CONCLUSION
Our study highlights both a similarity in symptoms reported by patients with PASC and PACVS, and distinct differences in symptom phenotypes, disease severity, and immunologic biomarkers. These unique characteristics may inform tailored laboratory and therapeutic approaches. Further research is needed to explore underlying mechanisms and to develop targeted interventions for these complex and novel syndromes