Authors: Jonathan A. Stefely,Bianca B. Christensen,Tasos Gogakos,Jensyn K. Cone Sullivan … See all authors First published: 24 August 2020 https://doi.org/10.1002/ajh.25979
Abstract
Coagulopathy causes morbidity and mortality in patients with coronavirus disease 2019 (COVID-19) due to severe acute respiratory syndrome coronavirus-2 (SARS-CoV-2) infection. Yet, the mechanisms are unclear and biomarkers are limited. Early in the pandemic, we observed markedly elevated factor V activity in a patient with COVID-19, which led us to measure factor V, VIII, and X activity in a cohort of 102 consecutive inpatients with COVID-19. Contemporaneous SARS-CoV-2-negative controls (n = 17) and historical pre-pandemic controls (n = 260-478) were also analyzed. This cohort represents severe COVID-19 with high rates of ventilator use (92%), line clots (47%), deep vein thrombosis or pulmonary embolism (DVT/PE) (23%), and mortality (22%). Factor V activity was significantly elevated in COVID-19 (median 150 IU/dL, range 34-248 IU/dL) compared to contemporaneous controls (median 105 IU/dL, range 22-161 IU/dL) (P < .001)—the strongest association with COVID-19 of any parameter studied, including factor VIII, fibrinogen, and D-dimer. Patients with COVID-19 and factor V activity >150 IU/dL exhibited significantly higher rates of DVT/PE (16/49, 33%) compared to those with factor V activity ≤150 IU/dL (7/53, 13%) (P = .03). Within this severe COVID-19 cohort, factor V activity associated with SARS-CoV-2 load in a sex-dependent manner. Subsequent decreases in factor V were linked to progression toward DIC and mortality. Together, these data reveal marked perturbations of factor V activity in severe COVID-19, provide links to SARS-CoV-2 disease biology and clinical outcomes, and nominate a candidate biomarker to investigate for guiding anticoagulation therapy in COVID-19.
1 INTRODUCTION
Typically, COVID-19, caused by SARS-CoV-2, presents as a respiratory illness, but coagulopathy can cause morbidity and mortality.1–7 Line clots, arterial clots, pulmonary thrombosis with microangiopathy, pedal acro-ischemia (“COVID-toes”), bleeding, and venous thromboembolism (VTE)—including deep venous thrombosis (DVT) and pulmonary embolism (PE)—have been associated with COVID-19, especially in severe cases.8–13 However, the underlying mechanisms remain unclear. Hypothesized mechanisms for thrombosis invoke inflammation, endothelial dysregulation, patient immobilization, antiphospholipid antibodies, and coagulation factor VIII dysregulation.14–20 However, direct links between the SARS-CoV-2 virus and coagulopathy remain unmapped. Common laboratory findings include elevations of D-dimer and the acute phase reactants fibrinogen and factor VIII,21–28 but additional and more specific biomarkers for guiding prognosis and anticoagulation therapy would be valuable.
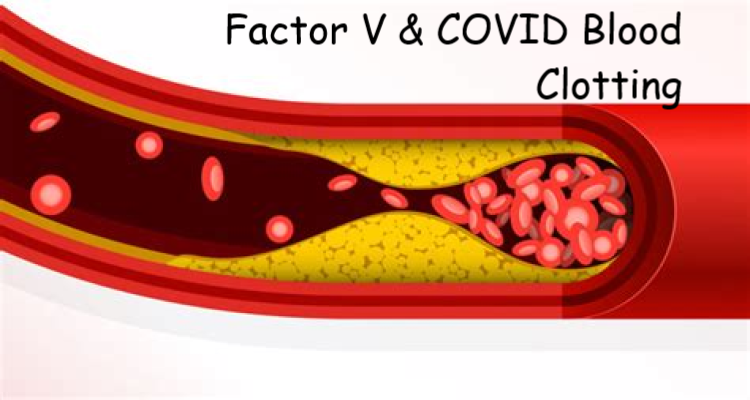
Near the beginning of the COVID-19 pandemic in Massachusetts, USA in March of 2020, we obtained an early specimen from a patient with severe COVID-19 on a ventilator. Coagulation laboratory testing revealed an unexpected and unusual elevation of factor V activity at 248 IU/dL (reference range 60-150 IU/dL), and 4 days later this patient developed a saddle PE. This was the highest factor V activity level ever observed in our high-volume coagulation laboratory. Since initiating daily interpretation for every patient tested by our high-volume coagulation laboratory starting in 1994, we had never seen factor V activity >200 IU/dL before, and factor V elevations above 150 IU/dL (above the reference range) were uncommon prior to the pandemic. In the coagulation cascade, activated factor V interacts with activated factor X to form the prothrombinase complex, which catalyzes formation of thrombin and leads to fibrin clot formation. Dysregulation of factor V due to factor V Leiden is a well-known cause of a prothrombotic state.29 Concurrent elevations of factor V activity and factor VIII activity have also been linked to increased VTE risk in one study.30 Thus, we hypothesized that venous thromboembolism and possibly other complications of severe COVID-19 are associated with perturbations of factor V activity.
2 METHODS
2.1 Study population and design
2.1.1 COVID-19 cases
The primary patient specimens in this prospective cohort study were collected over approximately 1 month at the beginning of the COVID-19 pandemic in Massachusetts, USA (March 23, 2020 to April 27, 2020) under an institutional review board-approved study protocol. All authors had access to and analyzed the primary data set, which is also included here as a resource (Table S1). The study site was the Massachusetts General Hospital (MGH), an approximately 1000-bed academic medical center and one of the primary regional referral centers for patients with severe COVID-19. Both SARS-CoV-2 polymerase chain reaction (PCR) positive (“COVID-19”) cases and SARS-CoV-2 PCR negative (“contemporaneous control”) cases were collected from the population of patients with specimens submitted to the MGH Special Coagulation Laboratory. During most of the study period, the inpatient hematology team sent special coagulation testing specimens to our laboratory from all patients in the intensive care units with COVID-19 because of reports of coagulopathy associated with COVID-19. The resultant cohort of 102 inpatients with COVID-19 is comprised of all 102 SARS-CoV-2 positive patient specimens submitted to our coagulation laboratory during the study period without any exclusion criteria. We did not specify additional inclusion criteria other than a positive SARS-CoV-2 test. We measured a panel of coagulation parameters in the earliest available specimen from each of these 102 inpatients with COVID-19.
2.1.2 Contemporaneous control cases
Our study period during the initial peak of the COVID-19 pandemic limited access to contemporaneous specimens from confirmed SARS-CoV-2 negative (“contemporaneous control”) patients submitted to our coagulation laboratory because hospital policies temporarily discontinued elective procedures and outpatient visits for patients without COVID-19. Nevertheless, we were able to obtain a group of specimens from SARS-CoV-2 negative controls (n = 17). We included all submitted specimens from SARS-CoV-2 negative patients on ventilators during the study period (n = 7), which was done by design to include patients with similar illness severity compared to our COVID-19 patients.
2.1.3 Historical control cases
For factors V, X, and VIII, D-dimer, and fibrinogen we also retrospectively obtained historical values from patients with specimens submitted to our laboratory prior to the COVID-19 pandemic. Factor V activity values were obtained from all patient specimens during the 4 years prior to the COVID-19 pandemic (April 2016 – February 2020) (n = 446), as well as all factor VIII activities from March 2019 – February 2020 (n = 478), all factor X activities from May 2016 – February 2020 (n = 346), and all fibrinogen (n = 260) and D-dimer (n = 373) measurements from days 1-14 of January 2020.
2.2 Determination of clinical variables
Patients with COVID-19 and contemporaneous controls were followed forward from the time of their first coagulation laboratory specimen to a median of 78 days (range 64-99 days) to determine clinical outcomes such as the development of DVT/PE. Clinical variables were determined by review of electronic medical records and reviewers were blinded to the results of the research coagulation factor assays. For COVID-19 cases, the date of symptom onset was determined by manual chart review, as documented in the admission note or the first note of the infectious disease consult. When discrepant dates were reported, the date reported in the note closest to admission was chosen. Ventilator use, extracorporeal membrane oxygenation (ECMO) use, and anticoagulation use at the time of the coagulation specimen collection were recorded. Line clots any time during the admission were recorded. DVT/PE and arterial clots were recorded if they occurred any time during the admission or if they were part of the reason for admission (the latter only occurred in SARS-CoV-2 negative patients, some of which were admitted for DVT/PE or stroke). Death was recorded. Discharge was noted if the patient was discharged to home or to a rehabilitation facility.
2.3 Determination of laboratory variables
Factor V, VIII, and X activities and activated partial thromboplastin time (aPTT) waveforms were measured in the same leftover clinical specimens using validated clinical laboratory assays (details below). The remaining parameters in the study were determined by review of existing clinical data. Note, SARS-CoV-2 real-time PCR (RT-PCR) cycle threshold (Ct) values for the diagnostic specimen were obtained from the instrument runs on either a Roche Cobas 6800 or a Cepheid GeneXpert Infinity System. If the Ct values for the diagnostic specimen were not available, the Ct values for the specimen closest to onset of symptoms were recorded. Prothrombin time (PT), aPTT, heparinase aPTT (all by Stago, Asnieres, France), and the activities of factors II, VII, IX, XI, and XII were recorded only if determined on a specimen collected within 6 hours of the study specimen. Both D-dimer (bioMerieux, Marcy-l’Étoile France) and fibrinogen (Stago) values were recorded at the closest time point to the study specimen and were only included if they were measured within 2 days of the study specimen. The following results were recorded at the closest time to the study specimen during the admission: PTT-LA, STACLOT-LA, protein S and antithrombin activity (all by Stago), platelet count, anticardiolipin and beta-2 glycoprotein I (INOVA, San Diego CA), chromogenic protein C activity and activated protein C resistance/factor V Leiden (APC V, Chromogenix, West Chester, OH). The International Society on Thrombosis and Haemostasis (ISTH) DIC scores were determined according to published guidelines.31
2.4 Coagulation factor assay methods
Factor assays were one-stage, PT-based for factors II, V, VII and X, and aPTT-based for factors VIII, IX, XI, and XII, using an ACL TOP 750 analyzer, Hemosil calibrator, Synthasil or Recombiplastin, all from Instrumentation Laboratory (Bedford MA, USA), and factor-deficient plasma from Precision Biologic (Dartmouth, NS, Canada). Three dilutions (1:10, 1:20, and 1:40) were automatically performed for each factor assay.
2.5 APTT waveform analyses
The ACL TOP analyzer automatically generates an aPTT waveform every time an aPTT is performed. Since the ACL TOP does not provide a quantitative measurement of the initial slope, waveforms were manually reviewed to determine if the initial slope was flat (normal) or sloped (abnormal and suggestive of DIC).32, 33 These determinations were made while blinded to all aspects of the study. The ACL TOP also provides a quantitative measurement of the aPTT waveform’s first derivative peak and second derivative peak and trough.34, 35
2.6 Statistical methods
For quantitative variables, P values were determined with a two-sided, heteroscedastic Student t test for normally-distributed data, and Mann-Whitney U-test for non-parametric data. Fisher’s exact test was used for categorical variables.
3 RESULTS
3.1 A cohort of patients with severe COVID-19
To begin testing the hypothesis that factor V activity elevation is associated with COVID-19, we measured a panel of coagulation parameters in the earliest available specimen from the first 102 SARS-CoV-2 positive patient specimens submitted to our coagulation laboratory without any exclusion criteria, 17 contemporaneous controls, and 260 to 478 historical controls per test prior to the COVID-19 pandemic.
This cohort of patients with COVID-19 was almost entirely comprised of severe cases based on the observed rate of ventilator use (92%) and ECMO use (7%) at the time of the analyzed coagulation specimen (Table 1). Our prospective follow-up revealed development of line clots (arterial or venous) in 47% (48/102) of the COVID-19 cases, suggesting widespread coagulopathy (Table 2). Furthermore, DVT and/or PE occurred in a striking 23/102 (23%) of these patients with COVID-19. Additionally, 22/102 (22%) of these patients with COVID-19 died before the end of the study period. The primary data set for this cohort, including clinical features and laboratory data, are provided as a resource (Table S1).TABLE 1. COVID-19 cohort characteristics
| Patients with COVID-19 (n = 102) | Contemporaneous controls (n = 17) | ||
|---|---|---|---|
| Age (years) median (range) | 61 (27-87) | 57 (15-85) | P > .05 |
| Male sex − no. (%) | 68 (67) | 9 (53) | P > .05 |
| Ventilator use − no. (%) | 94 (92) | 7 (41) | P < .001 |
| ECMO use − no. (%) | 7 (7) | 4 (24) | P > .05 |
| Anticoagulation at the time of the coagulation lab specimen | |||
| Prophylactic SQ heparin or enoxaparin − no. (%) | 59 (58) | 2 (12) | P > .05 |
| Therapeutic heparin or enoxaparin − no. (%) | 26 (25) | 4 (24) | P > .05 |
| Other dose of heparin or enoxaparin − no. (%) | 6 (6) | 0 (0) | P < .001 |
TABLE 2. Clinical outcomes and features
| Patients with COVID-19 (n = 102) | Contemporaneous controls (n = 17) | ||
|---|---|---|---|
| Line clot − no. (%) | 48 (47) | 3 (18) | P < .05 |
| VTE (DVT or PE) − no. (%) | 23 (23) | 7 (41) | P > .05 |
| Arterial clot − no. (%) | 9 (9) | 3 (18) | P > .05 |
| Discharge − no. (%) | 75 (74) | 12 (71) | P > .05 |
| Death − no. (%) | 22 (22) | 5 (29) | P > .05 |
- a Arterial clots included ischemic strokes and mesenteric ischemia.
3.2 Factor V is elevated in patients with severe COVID-19
Using a validated clinical laboratory assay, we found factor V activity to be markedly elevated in many patients in this severe COVID-19 cohort (median 150 IU/dL, n = 102) compared to the expected reference median value of 100 IU/dL activity (Figures 1A,B). Forty-nine of these cases (48%) fell above the reference range of 60-150 IU/dL. The degree of factor V elevation seen in these COVID-19 cases was notably higher than those seen previously at our hospital before COVID-19 (Figure 1A). Compared to all patient specimens tested in our laboratory during the 4 years prior to the COVID-19 pandemic (April 2016 – February 2020) (n = 446), factor V activity was significantly higher in our cohort of patients with severe COVID-19 (COVID-19 median 150 IU/dL, historical control median 81 IU/dL, P < .001) (Figure 1A). Among COVID-19 patients, 16/102 (16%) had factor V > 200 IU/dL, which was not seen in any of the contemporaneous or historical controls, and which has never been observed at MGH before (extending back to 1994 when daily review of all coagulation results began).

Our factor V assay is regularly validated for consistency across time. However, to alleviate concerns for a temporal drift in assay performance, we also measured factor V activity in contemporaneous SARS-CoV-2 negative control cases (median 105 IU/dL, n = 17), which were found to be overall similar to the historical controls (P > .1). Furthermore, factor V activity was significantly elevated in our cohort of patients with severe COVID-19 (median 150 IU/dL) compared to these contemporaneous controls (P <,001) (Figure 1A).
A sub-group analysis also demonstrated that factor V was significantly elevated in the COVID-19 cases (median 150 IU/dL) compared to both the contemporaneous control cases on ventilators (n = 7, median 54 IU/dL, P < .05) and the non-ventilated contemporaneous control cases (n = 10, median 107 IU/dL, P < .001). These findings suggest that the elevation of factor V in severe COVID-19 cannot be simply explained by a general state of severe illness or by ventilator use. Together with the rarity of factor V elevations before the COVID-19 pandemic, these findings suggest a more specific relationship between COVID-19 and factor V elevation.
3.3 Factor V elevation in severe COVID-19 is associated with DVT/PE
We examined DVT/PE events in this cohort to begin testing the hypothesis that elevated factor V activity is a risk factor for DVT/PE in severe COVID-19. Patients with COVID-19 and factor V activity above the upper limit of the reference range (>150 IU/dL) exhibited significantly higher rates of DVT/PE (16/49, 33%) compared to those with factor V activity less than or equal to 150 IU/dL (7/53, 13%) (P = .03). Moreover, among patients with COVID-19, factor V trends toward higher activities in patients who went on to develop DVT/PE (median 165 IU/dL, n = 23) compared to those that did not develop DVT/PE (median 145 IU/dL, n = 79) (P = .05). Together, these findings nominate factor V as a candidate biomarker for future clinical trials investigating VTE and anticoagulation therapies in patients with COVID-19.
The VTE rates were lower in patients with COVID-19 treated with anticoagulation (19/91, 21%) compared to those not treated with anticoagulation (4/11, 36%) at the time of the factor V activity specimen, but this difference was not statistically significant in this cohort (P = .3). Similarly, when restricting the analysis to COVID-19 cases with elevated factor V activity (>150 IU/dL), VTE rates were lower in patients treated with anticoagulation (13/44, 30%) compared to those not treated with anticoagulation (3/5, 60%), but this difference was not significant in this cohort (P = .3). Nonetheless, these findings provide a foundation for larger prospective studies of anticoagulation in cases of COVID-19, especially in cases with elevated factor V activity.
3.4 Factor V activity relationships in COVID-19
A study prior to the COVID-19 pandemic suggested that concurrent elevations of both factor V and its homolog factor VIII can increase risk for VTE in general,30 and factor VIII has been shown to be elevated in COVID-19. Thus, we also measured factor VIII activity in our cohort of patients with COVID-19 and the contemporaneous controls. Factor VIII activity was elevated in the COVID-19 cases (median 298 IU/dL, n = 100) compared to the reference range (50-200 IU/dL), the contemporaneous controls (median 222 IU/dL, n = 17, P < .01), and the historical controls (median 125 IU/dL, n = 478, P < .001) (Figure S1). The activities of factors V and VIII were not significantly correlated in our cohort (Spearman’s rho = 0.16; P > .05), suggesting distinct regulation (Figure 1C). Yet, 43/100 (43%) of the COVID-19 cases showed elevations of both factor V (>150 IU/dL) and factor VIII (>200 IU/dL) above their reference ranges. Thus, some patients with severe COVID-19 could be at risk for DVT/PE because of elevations of both factor V and factor VIII. In this cohort of COVID-19 cases, DVT/PE occurred in 13/43 (30%) of cases with elevations of both factor V and factor VIII but did not occur in the 11 cases with factor V < 150 IU/dL and factor VIII <200 IU/dL (P = .048) (Figure 1D).
We also measured the activity of factor X because its active form physically interacts with activated factor V and we questioned whether all coagulation factors were elevated. However, factor X activity was not altered in COVID-19 cases (median 106 IU/dL) compared to the reference range (60-150 IU/dL).
Additional coagulation parameters were extracted from existing clinical laboratory data (Table 3). Elevations of fibrinogen and D-dimer have been a point of emphasis in studies of COVID-19 coagulopathy. We also observed an elevation of D-dimer in COVID-19 cases (median 2849 ng/mL, n = 101) compared to the reference range (< 500 ng/mL) and historical controls (median 546, n = 373, P < .001). Likewise, we observed an elevation of fibrinogen in COVID-19 cases (median 763 mg/dL, n = 91) compared to the reference range (150-400 mg/dL), historical controls (median 349, n = 260, P < .001), and contemporaneous controls (median 212 mg/dL, n = 9, P < .001). In patients with COVID-19, we observed a correlation between the acute phase reactants fibrinogen and factor VIII (Figure 1E). Factor V showed a moderate correlation with its functional partner factor X, but factor V was not significantly correlated with the acute phase reactants fibrinogen and factor VIII (P > .05) (Figure 1E). Notably, among the coagulation parameters analyzed (Table 3, Figures 1 and S1), the elevation of factor V in these COVID-19 cases was the most significant difference compared to the contemporaneous controls and distinguished itself as the most striking difference compared to our laboratory’s historical results prior to the COVID-19 pandemic.TABLE 3. Coagulation parameters
| Reference range | Patients with COVID-19 | (n) | Contemporaneous controls | (n) | P value | |
|---|---|---|---|---|---|---|
| Primary prospective study test results | ||||||
| Factor V activity (IU/dL) median | 60–150 | 150 | 102 | 105 | 17 | P < .001 |
| Factor VIII activity (IU/dL) median | 50-200 | 298 | 100 | 222 | 17 | P < .01 |
| Factor X activity (IU/dL) median | 60–150 | 106 | 102 | 78 | 17 | P < .01 |
| Secondary retrospective study test results (obtained from existing clinical data when available) | ||||||
| D-dimer (ng/mL) median | < 500 | 2849 | 101 | 2420 | 10 | P > .05 |
| Fibrinogen (mg/dL) median | 150–400 | 763 | 91 | 212 | 9 | P < .001 |
| PT (seconds) median | 11.5-14.5 | 15.1 | 97 | 14.1 | 17 | P > .05 |
| aPTT (seconds) median | 22-36 | 38.1 | 101 | 31.9 | 17 | P > .05 |
| Abnormal aPTT waveform slope − no. (%) | Normal | 14 (15) | 94 | 5 (33) | 15 | P > .05 |
| aPTT waveform first derivative (TU/sec) median | 150-291 | 461 | 94 | 257 | 15 | P < .001 |
| aPTT waveform second derivative peak (TU/seĉ2) median | 488-1026 | 1485 | 94 | 993 | 15 | P < .001 |
| aPTT waveform second derivative trough median | NA | 585 | 94 | 430 | 15 | P < .05 |
| Platelet count (K/μL) median | 150–400 | 275 | 101 | 169 | 16 | P < .01 |
| ISTH DIC score median | < 5 | 2 | 86 | 4 | 6 | P < .05 |
| Antithrombin activity (IU/dL) median | 80-130 | 79 | 79 | 78 | 10 | P > .05 |
| Protein S activity (IU/dL) median | 70-150 | 50.5 | 18 | 91.5 | 6 | P < .05 |
| Protein C activity (IU/dL) median | 70–150 | 80 | 19 | 118.5 | 6 | P > .05 |
| Lupus anticoagulant − no. (%) | Negative | 25 (57) | 44 | 2 (15) | 13 | P < .05 |
| Anticardiolipin antibody − no. (%) | Negative | 21 (54) | 39 | 1 (9) | 11 | P < .05 |
| Beta-2-glycoprotein antibody − no. (%) | Negative | 3 (10) | 29 | 0 (0) | 5 | P > .05 |
| Activated protein C resistance (factor V Leiden screen) − no. (%) | Negative | 0 (0) | 9 | 0 (0) | 6 | NA |
| Factor II activity (IU/dL) median | 60–150 | 95 | 5 | NA | 0 | NA |
| Factor VII activity (IU/dL) median | 60-150 | 52 | 5 | NA | 0 | NA |
| Factor IX activity (IU/dL) median | 60-160 | 135 | 16 | 126 | 1 | NA |
| Factor XI activity (IU/dL) median | 60–160 | 98 | 16 | 57 | 1 | NA |
| Factor XII activity (IU/dL) median | 60–160 | 51 | 8 | NA | 0 | NA |
Nine COVID-19 patients were tested for activated protein C resistance (factor V Leiden), and all were normal (Table 3). As some of these patients had factor V activity above 200 IU/dL, it appears that factor V Leiden is not involved in the unusual factor V elevation.
3.5 COVID-19 progression toward DIC and death is associated with lower FV
Two patients with severe COVID-19 in our cohort had a second factor V activity measured later during their hospital course, in each case after worsening of clinical status as measured by increased ventilation requirements or increased vasopressor requirements. In one case, the initial factor V activity was 248 IU/dL, and 5 days later after severe clinical decompensation it dropped to 28 IU/dL. In a second case, the initial factor V activity was 206 IU/dL and after slight clinical worsening it decreased to 171 IU/dL. Based on these cases, we hypothesized that while patients with severe COVID-19 might initially present with markedly elevated factor V activity, a subsequent decline in factor V activity could be associated with clinical decompensation.
In our severe COVID-19 cohort, cases with factor V activity ≤150 IU/dL had a higher mortality (16/53, 30%) than those with factor V activity >150 IU/dL (6/49, 12%, P < .05). To investigate if this relationship with mortality could be due to consumption of factor V at the beginning stages of DIC, the aPTT waveform slope was assessed, which if abnormal, is associated with DIC or the prediction of DIC.32, 33 We examined the aPTT waveform shape and the peaks of the first and second derivatives of the aPTT waveform (Figure 1F). A sub-set of patients with severe COVID-19 showed an abnormal slope at the beginning of the aPTT waveform (Figures 1G,H), suggesting progression toward DIC. Factor V was lower in COVID-19 patients with an abnormal waveform slope, compared to COVID-19 patients with a normal slope (median 116 IU/dL vs 158 IU/dL, P = .005). Since these tests were performed on the earliest available specimen, ISTH DIC scores were calculated for all COVID-19 patients and contemporaneous controls, and none of them had scores indicating acute overt DIC at the time that the earliest specimen was collected. Thus, an abnormal slope in the aPTT waveform and/or factor V below 150 IU/dL may be early markers of a DIC-like process that appear before routine laboratory tests can diagnose DIC (D-dimer, fibrinogen, platelet count, and PT).
3.6 Factor V levels in severe COVID-19 are linked to SARS-CoV-2 load in a sex-dependent manner
Note, SARS-CoV-2 differentially affects patients based on their sex, with men often presenting with more severe COVID-19.6, 36 Coagulation parameters also vary based on sex.37 A review of our historical cases prior to the COVID-19 pandemic showed a small, but significant, difference in factor V activity in males compared to females (median 78 IU/dL and 84 IU/dL, respectively; P < .05). (Figure S2A). Thus, we investigated the possibility of a sex-dependent interaction between SARS-CoV-2 and factor V activity. Interestingly, males show a weak anticorrelation (Spearman’s R ~ −0.3) between SARS-CoV-2 RT-PCR Ct values and factor V activity (Figures S2B,C), suggesting that male COVID-19 patients with higher viral loads (lower Ct values) have higher factor V activity. The opposite trend is seen in women, where there is a weak correlation (Spearman’s R ~ 0.4) between Ct values and factor V activity (Figures S2D,E). These findings suggest a complex sex-dependent biological interaction between SARS-CoV-2 and the coagulation system of the infected patient. While many questions about possible biological mechanisms remain to be answered, these findings, together with the unique nature of the marked factor V activity elevations in severe COVID-19, raise the possibility of a specific link between SARS-CoV-2 disease biology and dysregulation of human coagulation.
4 DISCUSSION
In this COVID-19 cohort, representing severe cases with a high rate of line clots, VTE, and mortality, we observed marked elevation of factor V activity. To our knowledge, this is a novel characteristic of COVID-19. Previous studies linked elevations of D-dimer and the acute phase reactants fibrinogen and factor VIII to severe COVID-19,21–24 but these are non-specific findings that appear in many disease states and thus might not on their own explain the coagulopathy of COVID-19.2–6, 8–10 In contrast, since initiating daily interpretation for every patient tested by our high-volume coagulation laboratory starting in 1994, we had not seen factor V activity >200 IU/dL prior to the COVID-19 pandemic, suggesting that factor V elevation could be a relatively specific finding in severe COVID-19. The observed relationships between factor V activity and SARS-CoV-2 viral load also raises the possibility of a specific relationship between factor V and COVID-19.
Recently it was discovered that megakaryocytes are abundant in the lungs, heart, and other organs of patients with COVID-19.38 Since megakaryocytes produce platelets, which normally contain about 20%-25% of the factor V in blood, this might be related to the mechanism for the high factor V in our COVID-19 cohort. Normally, factor V in blood is produced by the liver and then some of the factor V is endocytosed by megakaryocytes.
Dysregulation of factor V due to factor V Leiden is a well-known cause of a prothrombotic state.29 Concurrent elevations of factor V and factor VIII activity have also been linked to increased VTE risk in general in a pre-COVID-19 cohort.30 In the present cohort of severe COVID-19 cases, we observed a statistically significant association between DVT/PE event rates and factor V activity elevations above the reference range. Moreover, we observed a trend toward higher factor V activities in COVID-19 cases complicated by DVT/PE. These findings nominate factor V as a candidate for mechanistic studies of COVID-19 coagulopathy and as a candidate biomarker for VTE risk in COVID-19. Further study is needed to determine if factor V activity can help guide initiation and dosing of anticoagulants in COVID-19.22, 39, 40 For example, in light of the findings presented here, one could hypothesize that patients with severe COVID-19 who have elevated factor V activity (>150 IU/dL) would benefit more from anticoagulation, such as low-molecular weight heparin doses above typical prophylactic doses, yet this hypothesis remains to be tested and must be balanced with the risk of bleeding in such cases.
In our severe COVID-19 cases, further progression toward a DIC-like state as assessed by aPTT waveform analysis was associated with a decrease in factor V activity, and relatively lower factor V activity was also associated with death. An abnormally sloped waveform is an early predictor of DIC.32, 33 In patients with COVID-19 and contemporaneous controls, first derivative peak, second derivative peak, and second derivative trough values for each aPTT waveform were also lower in patients with an abnormally sloped waveform (predicting DIC) compared to those with a normal waveform (data not shown). This is consistent with a prior report before the pandemic (not in COVID-19 patients) showing that the first and second derivative peaks are decreased in infectious DIC, but higher in patients with infections without DIC.34 Taken together, the results support that the abnormal slope identified in our study predicts DIC, which consequently may explain the significantly lower factor V and higher mortality seen in our patients with an abnormal waveform slope. These findings suggest that in severe COVID-19 cases, while elevations in factor V are common and are associated with hypercoagulability, normal or low factor V activity may be associated with progression toward DIC and risk of death. As such, measuring factor V activity could potentially be useful in two ways: first for identifying COVID-19 coagulopathy and the risk for DVT/PE, and second, for monitoring progression toward DIC in the most severe cases. Thus, factor V activity assays could have diagnostic and prognostic potential in COVID-19.
We re-measured DIC scores on the day of death for the 22 patients with COVID-19 who died, and their DIC scores had increased on average by one point and all had positive D-dimers, but the scores remained below the ISTH cut-off for acute DIC (data not shown). This could be because fibrinogen and factor V are higher with COVID-19 than with other patients at risk for DIC, therefore making it more difficult for two of the four DIC score components to cross the DIC cut-off (fibrinogen and PT, since the PT is shortened by higher fibrinogen and factor V levels). However, platelet counts also did not reach the DIC cut-off in most cases. As noted, the DIC scores could suggest that the aPTT waveform is detecting a DIC-like state that routine laboratory tests do not detect as easily.
Another reason that it is important for hematologists to know that factor V can be elevated with COVID-19 is that it can cause misdiagnosis when interpreting coagulation factor panels. In our experience, factor V elevation in COVID-19 can cause an erroneous diagnosis of vitamin K deficiency in patients with liver dysfunction or DIC (factors II, VII, and X low with normal or elevated factor V). Usually factor V would be low in liver dysfunction or DIC, and the fact that it is normal or elevated gives the false appearance of a deficiency of only the vitamin K dependent PT factors. Thus our findings are important for clinical interpretation of coagulation panels for patients with COVID-19, and could alter management decisions for some patients with suspected liver dysfunction, DIC, or vitamin K deficiency.
Antiphospholipid antibodies (lupus anticoagulant, anticardiolipin, and beta-2 glycoprotein I antibodies) were detected in a high percentage of COVID-19 patients (Table 3). Repeat testing after 12 weeks would be needed to determine if these are transient due to infection or if they persist and could increase the risk for thrombosis.
A limitation of this study is the lack of mildly symptomatic or asymptomatic COVID-19 cases in our cohort, and the relatively small number of contemporaneous controls. Our ability to collect an equivalent contemporaneous control census was limited due to a markedly decreased non-COVID-19 inpatient census at the height of the pandemic at our hospital. Nevertheless, our contemporaneous control group was as severely ill as the COVID-19 group, as indicated by the similar rates of death, discharge, venous or arterial thrombosis, ECMO, and similar ages and sex ratio. The rate of line clots with COVID-19 was markedly high, and significantly higher than in the contemporaneous controls, which might help answer the question as to whether the risk for thrombosis is higher in COVID-19 than in other similarly ill ICU patients without COVID-19. Strengths of this study include the number of severe COVID-19 cases in our cohort, the depth of our coagulation testing for this cohort, and the large number of historical controls, which provide a comprehensive view of pre-COVID-19 pandemic factor V activities and other coagulation parameters. Our de-identified primary data set is included here as a resource (Table S1).
In summary, factor V activity was significantly higher in severe COVID-19 patients than in contemporaneous controls as well as historical controls, and high factor V activity was associated with thromboembolic complications of COVID-19. In contrast, patients with COVID-19 and a relatively lower factor V activity had a higher mortality and a higher incidence of an abnormally sloped waveform, which is an early predictor of DIC. Thus, our study reveals factor V perturbations as a previously unrecognized feature of severe COVID-19, adds a mechanistic candidate to ongoing investigations of COVID-19 coagulopathy with potential links to SARS-CoV-2 disease biology, and provides a foundation for future studies of COVID-19 coagulopathy diagnosis and biomarkers for guiding anticoagulation therapy in severe COVID-19.
ACKNOWLEDGEMENTS
We thank all members of the MGH Special Coagulation Laboratory for their selfless dedication to patient care during the COVID-19 pandemic and for their support of this research study, in particular: Briana Malley, Barbara Pereira, Stoja Islamovic, Ryan Mize, and Fils-Amie Lucien. We thank Sarah E. Turbett and Melis N. Anahtar for help with viral load data collection and input in analysis of the viral load data.